| Red | Green | Blue | |
| z | 17.63 | ||
| znorm | Inf | ||
| sky | -NaN | -NaN | -NaN |
| S/N | 32.8 | 56.6 | 66.4 |
| S/N(c) | 0.0 | 0.0 | 0.0 |
| SN(E/C) |


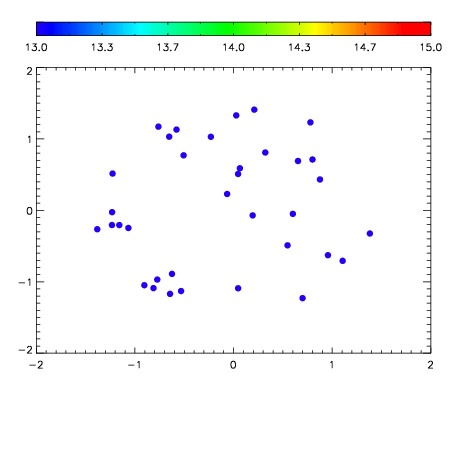

| Frame | Nreads | Zeropoints | Mag plots | Spatial mag deviation | Spatial sky 16325A emission deviations (filled: sky, open: star) | Spatial sky continuum emission | Spatial sky telluric CO2 absorption deviations (filled: H < 10) | |||||||||||||||||||||||
| 0 | 0 |
|
|
|
|
|
|
| IPAIR | NAME | SHIFT | NEWSHIFT | S/N | NAME | SHIFT | NEWSHIFT | S/N |
| 0 | 14990032 | 0.500352 | 0.00000 | 19.0527 | 14990033 | -5.44911e-05 | 0.500407 | 19.1112 |
| 1 | 14990024 | 0.499551 | 0.000801027 | 19.0441 | 14990026 | 0.00103925 | 0.499313 | 19.0348 |
| 2 | 14990027 | 0.499778 | 0.000574023 | 19.0027 | 14990029 | 0.000712855 | 0.499639 | 19.0222 |
| 3 | 14990031 | 0.499529 | 0.000823021 | 19.0016 | 14990025 | 0.00132030 | 0.499032 | 19.0212 |
| 4 | 14990023 | 0.499654 | 0.000698030 | 18.9965 | 14990030 | 0.000153758 | 0.500198 | 19.0123 |
| 5 | 14990028 | 0.500099 | 0.000253022 | 18.9893 | 14990022 | 0.00000 | 0.500352 | 18.9474 |