| Red | Green | Blue | |
| z | 17.65 | ||
| znorm | Inf | ||
| sky | -Inf | -Inf | -Inf |
| S/N | 7.9 | 12.7 | 14.8 |
| S/N(c) | 0.0 | 0.0 | 0.0 |
| SN(E/C) |
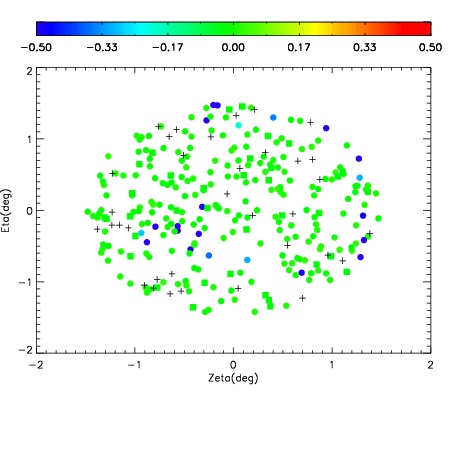
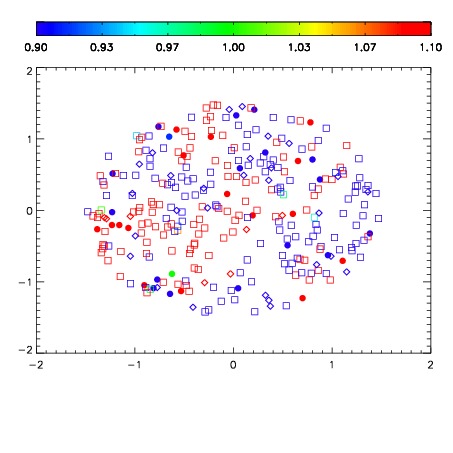
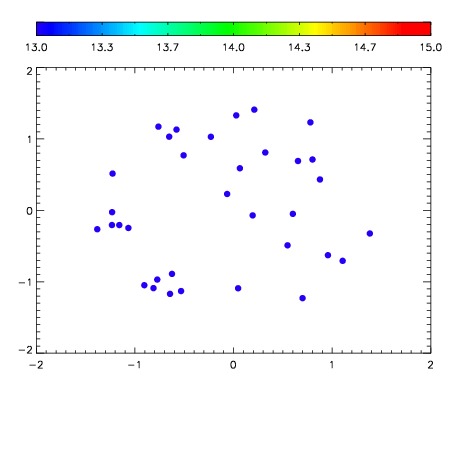

| Frame | Nreads | Zeropoints | Mag plots | Spatial mag deviation | Spatial sky 16325A emission deviations (filled: sky, open: star) | Spatial sky continuum emission | Spatial sky telluric CO2 absorption deviations (filled: H < 10) | |||||||||||||||||||||||
| 0 | 0 |
|
|
|
|
|
|
| IPAIR | NAME | SHIFT | NEWSHIFT | S/N | NAME | SHIFT | NEWSHIFT | S/N |
| 0 | 15210039 | 0.508947 | 0.00000 | 15.2720 | 15210040 | 0.00164414 | 0.507303 | 15.4482 |
| 1 | 15210035 | 0.508181 | 0.000766039 | 18.3943 | 15210033 | 0.00000 | 0.508947 | 17.9907 |
| 2 | 15210034 | 0.507894 | 0.00105304 | 18.3184 | 15210036 | -2.62936e-05 | 0.508973 | 17.7144 |
| 3 | 15210038 | 0.508314 | 0.000633001 | 16.1025 | 15210037 | 0.000433226 | 0.508514 | 16.1944 |