| Red | Green | Blue | |
| z | 17.64 | ||
| znorm | Inf | ||
| sky | -Inf | -NaN | -NaN |
| S/N | 23.8 | 41.6 | 47.0 |
| S/N(c) | 0.0 | 0.0 | 0.0 |
| SN(E/C) |

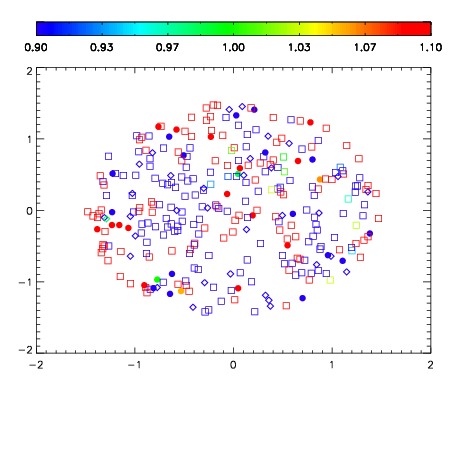


| Frame | Nreads | Zeropoints | Mag plots | Spatial mag deviation | Spatial sky 16325A emission deviations (filled: sky, open: star) | Spatial sky continuum emission | Spatial sky telluric CO2 absorption deviations (filled: H < 10) | |||||||||||||||||||||||
| 0 | 0 |
|
|
|
|
|
|
| IPAIR | NAME | SHIFT | NEWSHIFT | S/N | NAME | SHIFT | NEWSHIFT | S/N |
| 0 | 15260043 | 0.507638 | 0.00000 | 19.0769 | 15260037 | 0.00000 | 0.507638 | 18.9931 |
| 1 | 15260038 | 0.506401 | 0.00123698 | 19.0681 | 15260044 | 0.00236717 | 0.505271 | 18.9198 |
| 2 | 15260039 | 0.506921 | 0.000716984 | 19.0289 | 15260040 | 0.00139450 | 0.506243 | 18.8714 |
| 3 | 15260042 | 0.507010 | 0.000627995 | 18.9706 | 15260041 | 0.00156334 | 0.506075 | 18.4350 |