| Red | Green | Blue | |
| z | 17.64 | ||
| znorm | Inf | ||
| sky | -Inf | -Inf | -NaN |
| S/N | 27.5 | 47.2 | 52.5 |
| S/N(c) | 0.0 | 0.0 | 0.0 |
| SN(E/C) |
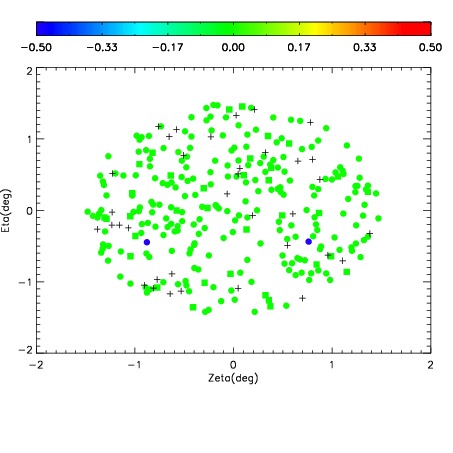
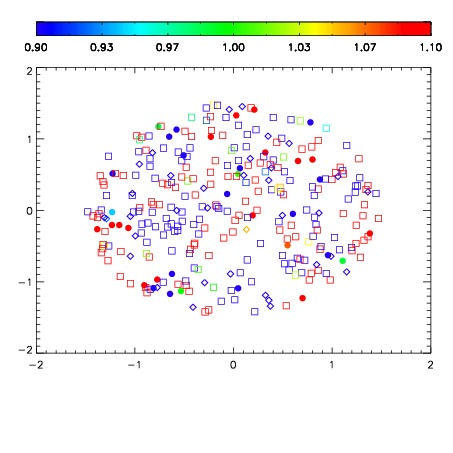
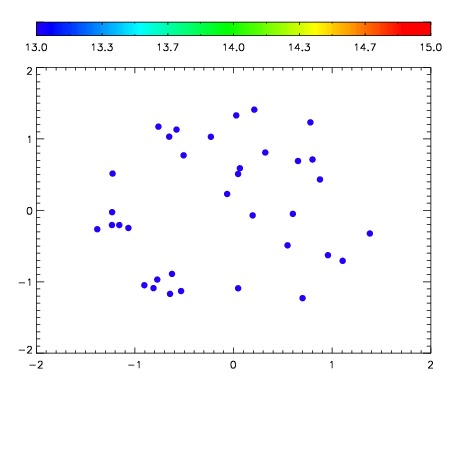

| Frame | Nreads | Zeropoints | Mag plots | Spatial mag deviation | Spatial sky 16325A emission deviations (filled: sky, open: star) | Spatial sky continuum emission | Spatial sky telluric CO2 absorption deviations (filled: H < 10) | |||||||||||||||||||||||
| 0 | 0 |
|
|
|
|
|
|
| IPAIR | NAME | SHIFT | NEWSHIFT | S/N | NAME | SHIFT | NEWSHIFT | S/N |
| 0 | 15460024 | 0.495191 | 0.00000 | 19.0680 | 15460029 | 0.000565225 | 0.494626 | 18.9892 |
| 1 | 15460023 | 0.494926 | 0.000265002 | 19.1423 | 15460022 | 0.00000 | 0.495191 | 19.1251 |
| 2 | 15460028 | 0.494345 | 0.000845999 | 19.1083 | 15460025 | -0.000234935 | 0.495426 | 19.0766 |
| 3 | 15460027 | 0.494629 | 0.000562012 | 19.0691 | 15460026 | -1.95192e-05 | 0.495211 | 19.0288 |