| Red | Green | Blue | |
| z | 17.65 | ||
| znorm | Inf | ||
| sky | -Inf | -Inf | -Inf |
| S/N | 29.2 | 47.7 | 50.6 |
| S/N(c) | 29.4 | 50.3 | 69.6 |
| SN(E/C) |
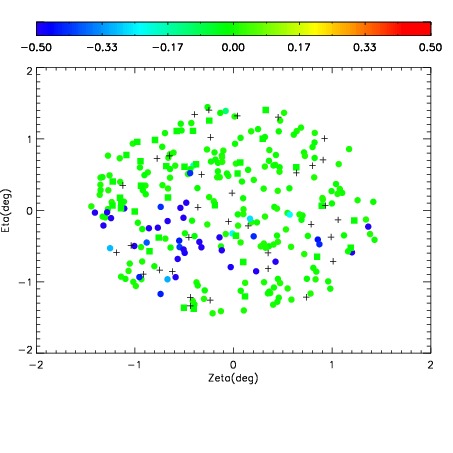
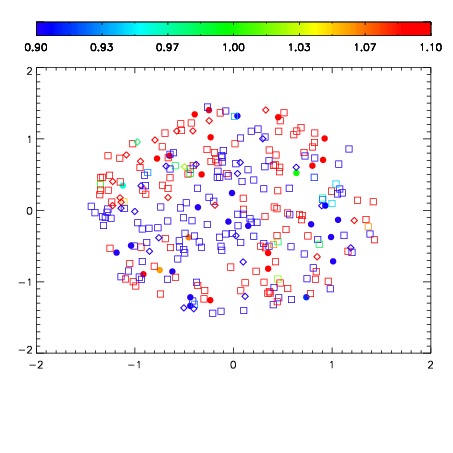
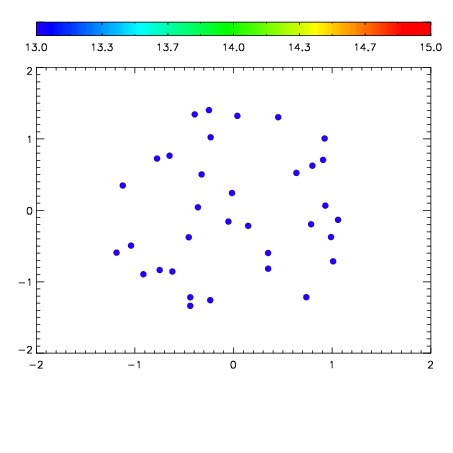

| Frame | Nreads | Zeropoints | Mag plots | Spatial mag deviation | Spatial sky 16325A emission deviations (filled: sky, open: star) | Spatial sky continuum emission | Spatial sky telluric CO2 absorption deviations (filled: H < 10) | |||||||||||||||||||||||
| 0 | 0 |
|
|
|
|
|
|
| IPAIR | NAME | SHIFT | NEWSHIFT | S/N | NAME | SHIFT | NEWSHIFT | S/N |
| 0 | 14660020 | 0.495415 | 0.00000 | 18.8519 | 14660018 | -0.00133136 | 0.496746 | 18.8068 |
| 1 | 14660019 | 0.494795 | 0.000620008 | 18.9513 | 14660021 | -5.73075e-05 | 0.495472 | 18.8988 |
| 2 | 14660016 | 0.493959 | 0.00145599 | 18.6380 | 14660017 | -0.00113050 | 0.496545 | 18.6140 |
| 3 | 14660015 | 0.493710 | 0.00170499 | 18.5756 | 14660014 | 0.00000 | 0.495415 | 18.4956 |