| Red | Green | Blue | |
| z | 17.64 | ||
| znorm | Inf | ||
| sky | -Inf | -NaN | -Inf |
| S/N | 22.2 | 37.0 | 38.8 |
| S/N(c) | 27.7 | 38.0 | 56.7 |
| SN(E/C) |
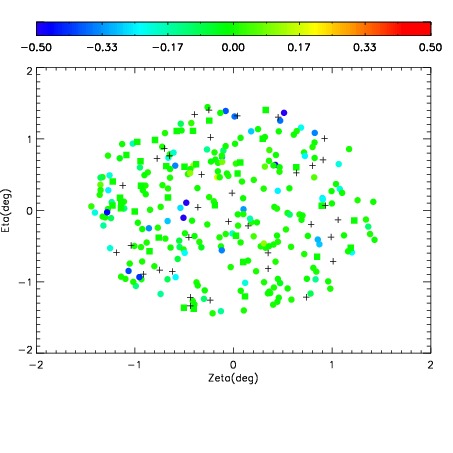
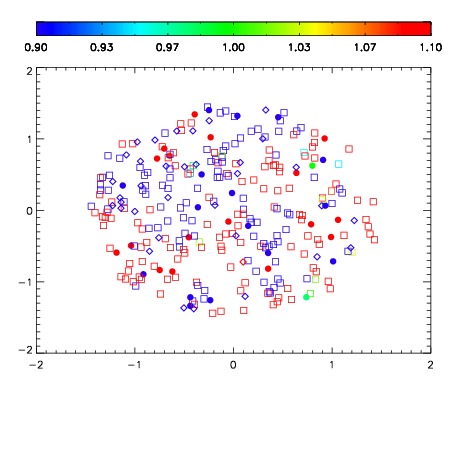


| Frame | Nreads | Zeropoints | Mag plots | Spatial mag deviation | Spatial sky 16325A emission deviations (filled: sky, open: star) | Spatial sky continuum emission | Spatial sky telluric CO2 absorption deviations (filled: H < 10) | |||||||||||||||||||||||
| 0 | 0 |
|
|
|
|
|
|
| IPAIR | NAME | SHIFT | NEWSHIFT | S/N | NAME | SHIFT | NEWSHIFT | S/N |
| 0 | 14870028 | 0.500021 | 0.00000 | 18.5196 | 14870022 | 0.00000 | 0.500021 | 18.3128 |
| 1 | 14870024 | 0.500011 | 9.95398e-06 | 18.7734 | 14870025 | 2.11314e-05 | 0.500000 | 18.4997 |
| 2 | 14870023 | 0.499459 | 0.000561982 | 18.6849 | 14870026 | -0.000498616 | 0.500520 | 18.3342 |
| 3 | 14870027 | 0.499978 | 4.29749e-05 | 18.4103 | 14870029 | -0.000499641 | 0.500521 | 18.1419 |