| Red | Green | Blue | |
| z | 17.64 | ||
| znorm | Inf | ||
| sky | -Inf | -NaN | -NaN |
| S/N | 32.2 | 51.3 | 54.0 |
| S/N(c) | 33.2 | 55.9 | 0.5 |
| SN(E/C) |
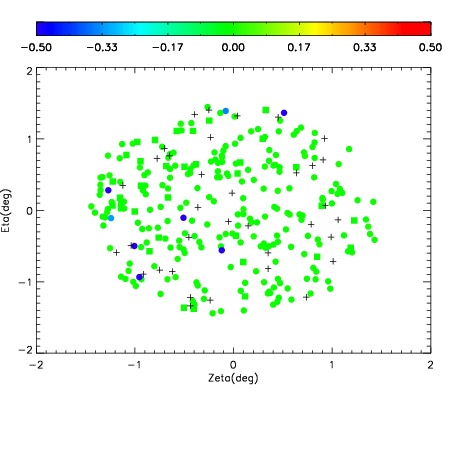


| Frame | Nreads | Zeropoints | Mag plots | Spatial mag deviation | Spatial sky 16325A emission deviations (filled: sky, open: star) | Spatial sky continuum emission | Spatial sky telluric CO2 absorption deviations (filled: H < 10) | |||||||||||||||||||||||
| 0 | 0 |
|
|
|
|
|
|
| IPAIR | NAME | SHIFT | NEWSHIFT | S/N | NAME | SHIFT | NEWSHIFT | S/N |
| 0 | 14940032 | 0.501844 | 0.00000 | 19.0767 | 14940033 | 0.00125639 | 0.500588 | 19.0783 |
| 1 | 14940031 | 0.500682 | 0.00116199 | 19.0722 | 14940029 | 0.000441865 | 0.501402 | 18.9939 |
| 2 | 14940027 | 0.499135 | 0.00270900 | 18.9349 | 14940030 | -0.000448393 | 0.502292 | 18.9820 |
| 3 | 14940028 | 0.499984 | 0.00185999 | 18.9320 | 14940026 | 0.00000 | 0.501844 | 18.9490 |