| Red | Green | Blue | |
| z | 17.65 | ||
| znorm | Inf | ||
| sky | -Inf | -NaN | -NaN |
| S/N | 30.4 | 48.8 | 50.9 |
| S/N(c) | 32.2 | 44.0 | 66.5 |
| SN(E/C) |

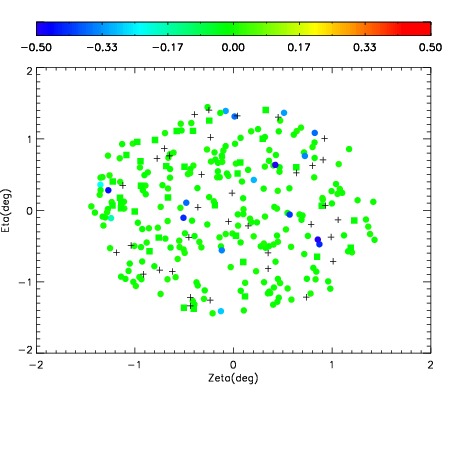
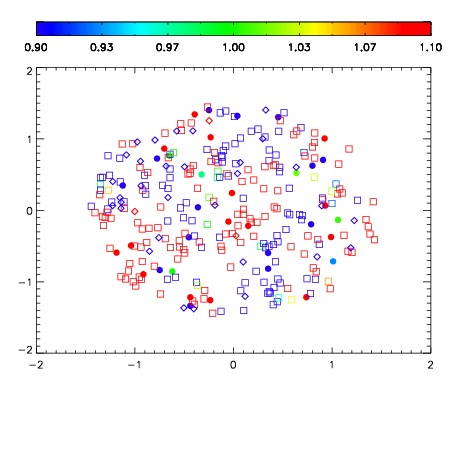


| Frame | Nreads | Zeropoints | Mag plots | Spatial mag deviation | Spatial sky 16325A emission deviations (filled: sky, open: star) | Spatial sky continuum emission | Spatial sky telluric CO2 absorption deviations (filled: H < 10) | |||||||||||||||||||||||
| 0 | 0 |
|
|
|
|
|
|
| IPAIR | NAME | SHIFT | NEWSHIFT | S/N | NAME | SHIFT | NEWSHIFT | S/N |
| 0 | 14970026 | 0.497615 | 0.00000 | 18.8295 | 14970025 | 0.00000 | 0.497615 | 18.5478 |
| 1 | 14970030 | 0.497054 | 0.000560999 | 18.8962 | 14970028 | -1.61468e-07 | 0.497615 | 19.0318 |
| 2 | 14970027 | 0.497422 | 0.000193000 | 18.8915 | 14970029 | -0.000278361 | 0.497893 | 18.9809 |
| 3 | 14970031 | 0.497448 | 0.000167012 | 18.8653 | 14970032 | -0.000284126 | 0.497899 | 18.9455 |