| Red | Green | Blue | |
| z | 17.65 | ||
| znorm | Inf | ||
| sky | -Inf | -Inf | -Inf |
| S/N | 29.6 | 42.9 | 49.4 |
| S/N(c) | 36.3 | 47.3 | 75.9 |
| SN(E/C) |
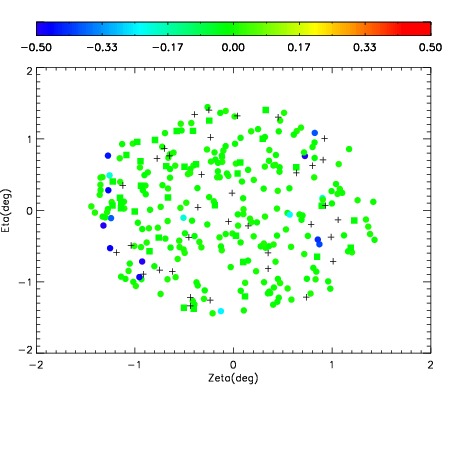
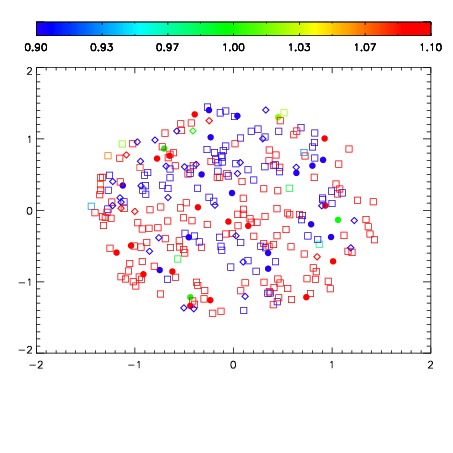


| Frame | Nreads | Zeropoints | Mag plots | Spatial mag deviation | Spatial sky 16325A emission deviations (filled: sky, open: star) | Spatial sky continuum emission | Spatial sky telluric CO2 absorption deviations (filled: H < 10) | |||||||||||||||||||||||
| 0 | 0 |
|
|
|
|
|
|
| IPAIR | NAME | SHIFT | NEWSHIFT | S/N | NAME | SHIFT | NEWSHIFT | S/N |
| 0 | 15190017 | 0.511083 | 0.00000 | 18.6898 | 15190018 | 0.000491887 | 0.510591 | 18.5779 |
| 1 | 15190012 | 0.509280 | 0.00180298 | 19.0160 | 15190014 | 0.00120041 | 0.509883 | 19.0255 |
| 2 | 15190013 | 0.509671 | 0.00141203 | 18.9913 | 15190015 | 0.00106694 | 0.510016 | 19.0062 |
| 3 | 15190016 | 0.509965 | 0.00111800 | 18.8333 | 15190011 | 0.00000 | 0.511083 | 18.9854 |