| Red | Green | Blue | |
| z | 17.65 | ||
| znorm | Inf | ||
| sky | -Inf | -Inf | -NaN |
| S/N | 32.4 | 51.7 | 53.9 |
| S/N(c) | 39.9 | 53.3 | 0.5 |
| SN(E/C) |
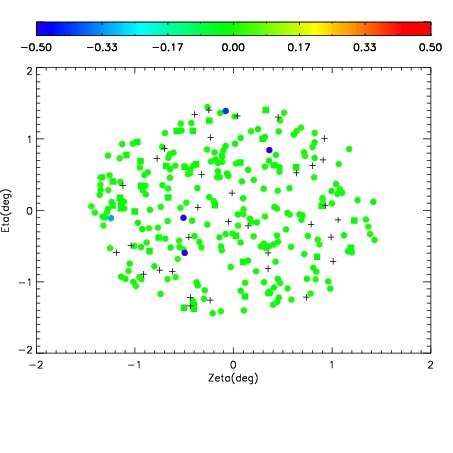

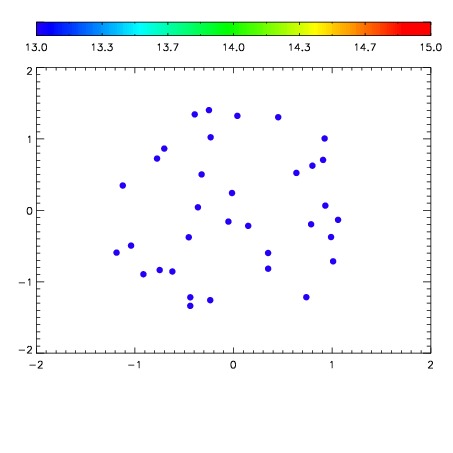

| Frame | Nreads | Zeropoints | Mag plots | Spatial mag deviation | Spatial sky 16325A emission deviations (filled: sky, open: star) | Spatial sky continuum emission | Spatial sky telluric CO2 absorption deviations (filled: H < 10) | |||||||||||||||||||||||
| 0 | 0 |
|
|
|
|
|
|
| IPAIR | NAME | SHIFT | NEWSHIFT | S/N | NAME | SHIFT | NEWSHIFT | S/N |
| 0 | 15250017 | 0.509693 | 0.00000 | 19.0894 | 15250015 | 0.00156619 | 0.508127 | 19.0896 |
| 1 | 15250016 | 0.509369 | 0.000324011 | 19.1157 | 15250018 | 0.00465006 | 0.505043 | 19.1122 |
| 2 | 15250013 | 0.507705 | 0.00198805 | 19.0451 | 15250014 | 0.00125387 | 0.508439 | 19.0754 |
| 3 | 15250012 | 0.507338 | 0.00235504 | 19.0347 | 15250011 | 0.00000 | 0.509693 | 18.9989 |