| Red | Green | Blue | |
| z | 17.64 | ||
| znorm | Inf | ||
| sky | -Inf | -Inf | -Inf |
| S/N | 20.0 | 33.0 | 35.7 |
| S/N(c) | 30.1 | 39.9 | 32.7 |
| SN(E/C) |
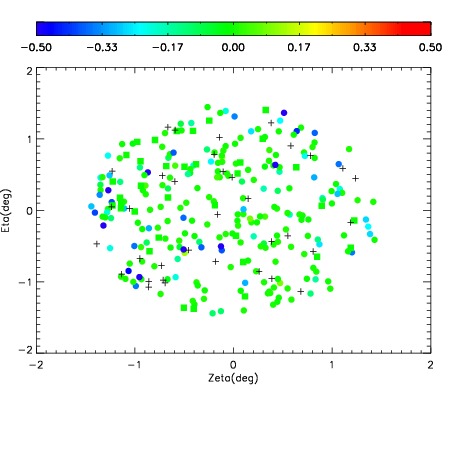
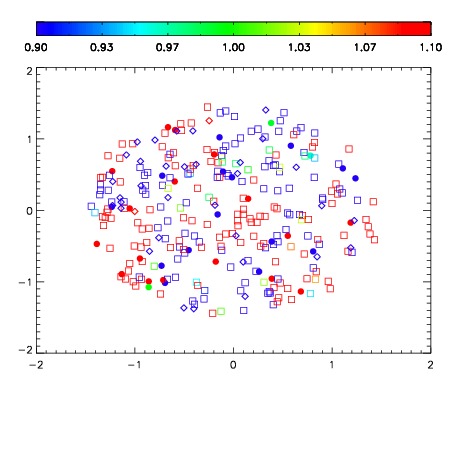
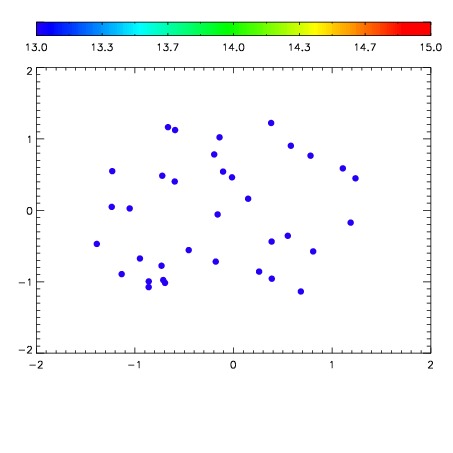

| Frame | Nreads | Zeropoints | Mag plots | Spatial mag deviation | Spatial sky 16325A emission deviations (filled: sky, open: star) | Spatial sky continuum emission | Spatial sky telluric CO2 absorption deviations (filled: H < 10) | |||||||||||||||||||||||
| 0 | 0 |
|
|
|
|
|
|
| IPAIR | NAME | SHIFT | NEWSHIFT | S/N | NAME | SHIFT | NEWSHIFT | S/N |
| 0 | 17670084 | 0.508115 | 0.00000 | 19.1870 | 17670082 | 0.00000 | 0.508115 | 19.1742 |
| 1 | 17670083 | 0.507256 | 0.000859022 | 19.1687 | 17670085 | 0.00251783 | 0.505597 | 19.1631 |