| Red | Green | Blue | |
| z | 17.65 | ||
| znorm | Inf | ||
| sky | -Inf | -Inf | -Inf |
| S/N | 29.4 | 49.6 | 54.7 |
| S/N(c) | 41.5 | 69.8 | 98.8 |
| SN(E/C) |
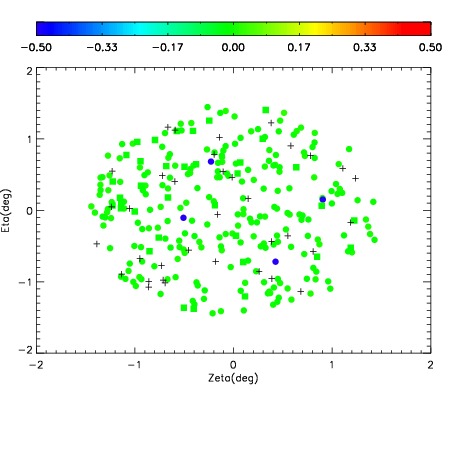
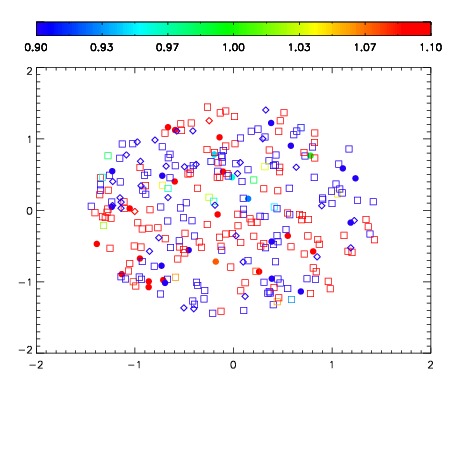
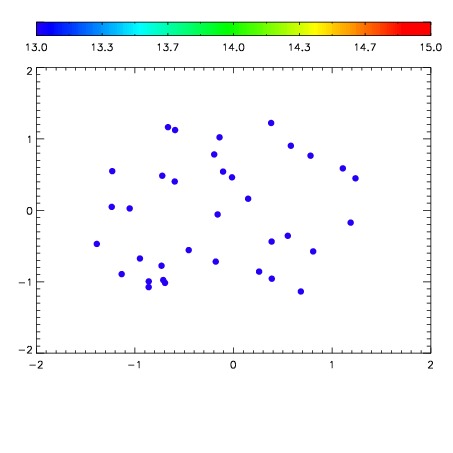

| Frame | Nreads | Zeropoints | Mag plots | Spatial mag deviation | Spatial sky 16325A emission deviations (filled: sky, open: star) | Spatial sky continuum emission | Spatial sky telluric CO2 absorption deviations (filled: H < 10) | |||||||||||||||||||||||
| 0 | 0 |
|
|
|
|
|
|
| IPAIR | NAME | SHIFT | NEWSHIFT | S/N | NAME | SHIFT | NEWSHIFT | S/N |
| 0 | 17970040 | 0.507371 | 0.00000 | 19.0579 | 17970034 | 0.00000 | 0.507371 | 19.1390 |
| 1 | 17970036 | 0.506967 | 0.000404000 | 19.0535 | 17970037 | 0.00192409 | 0.505447 | 19.0531 |
| 2 | 17970035 | 0.506905 | 0.000465989 | 19.0439 | 17970038 | 0.00210490 | 0.505266 | 19.0190 |
| 3 | 17970039 | 0.507170 | 0.000200987 | 19.0178 | 17970041 | 0.00219293 | 0.505178 | 18.9815 |
| 4 | 17970043 | 0.506012 | 0.00135899 | 18.9392 | 17970042 | 0.00259513 | 0.504776 | 18.9082 |
| 5 | 17970044 | 0.506715 | 0.000656009 | 18.8467 | 17970045 | 0.00107640 | 0.506295 | 18.6598 |