| Red | Green | Blue | |
| z | 17.64 | ||
| znorm | Inf | ||
| sky | -Inf | -Inf | -NaN |
| S/N | 29.4 | 48.4 | 53.2 |
| S/N(c) | 52.3 | 52.4 | 76.0 |
| SN(E/C) |
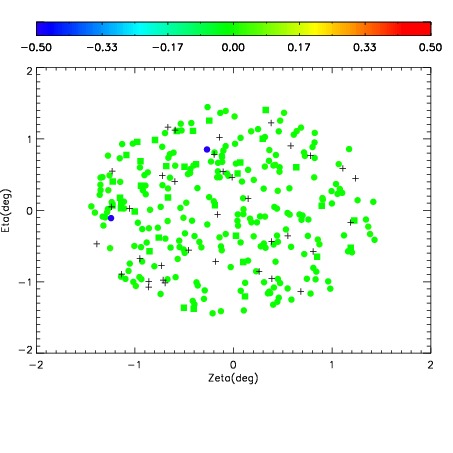
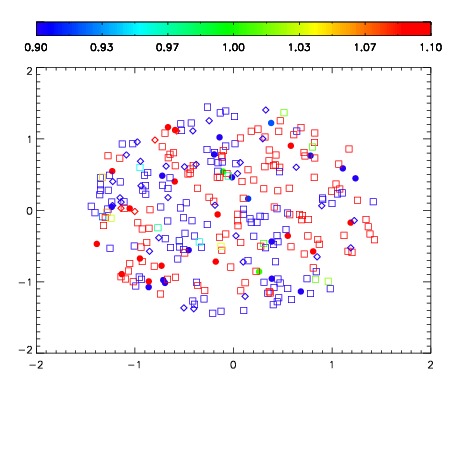
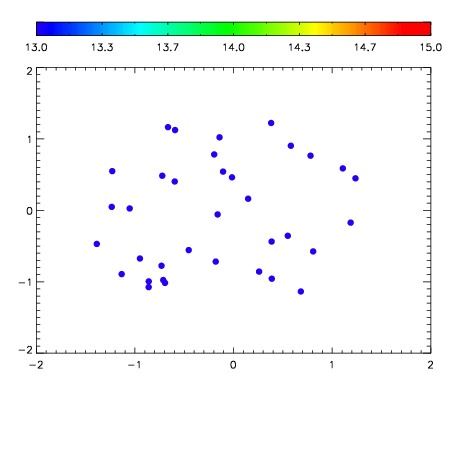

| Frame | Nreads | Zeropoints | Mag plots | Spatial mag deviation | Spatial sky 16325A emission deviations (filled: sky, open: star) | Spatial sky continuum emission | Spatial sky telluric CO2 absorption deviations (filled: H < 10) | |||||||||||||||||||||||
| 0 | 0 |
|
|
|
|
|
|
| IPAIR | NAME | SHIFT | NEWSHIFT | S/N | NAME | SHIFT | NEWSHIFT | S/N |
| 0 | 18160081 | 0.000934634 | 0.00000 | 18.4854 | 18160082 | -0.498968 | 0.499903 | 18.0797 |
| 1 | 18160073 | 0.00000 | 0.000934634 | 19.0145 | 18160075 | -0.498757 | 0.499692 | 19.0601 |
| 2 | 18160076 | 5.12550e-05 | 0.000883379 | 18.8618 | 18160074 | -0.499552 | 0.500487 | 19.0479 |
| 3 | 18160084 | -0.000831439 | 0.00176607 | 18.8281 | 18160079 | -0.498775 | 0.499710 | 18.9822 |
| 4 | 18160080 | 0.000759675 | 0.000174959 | 18.7918 | 18160078 | -0.498872 | 0.499807 | 18.9198 |
| 5 | 18160077 | 7.28527e-07 | 0.000933905 | 18.4888 | 18160083 | -0.498613 | 0.499548 | 18.6971 |