| Red | Green | Blue | |
| z | 17.64 | ||
| znorm | Inf | ||
| sky | -Inf | -Inf | -Inf |
| S/N | 26.4 | 41.7 | 45.3 |
| S/N(c) | 40.8 | 53.1 | 28.6 |
| SN(E/C) |
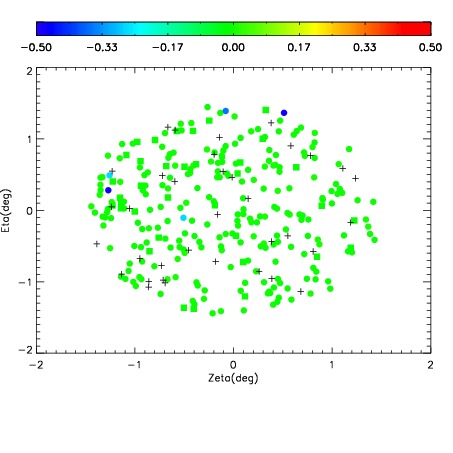
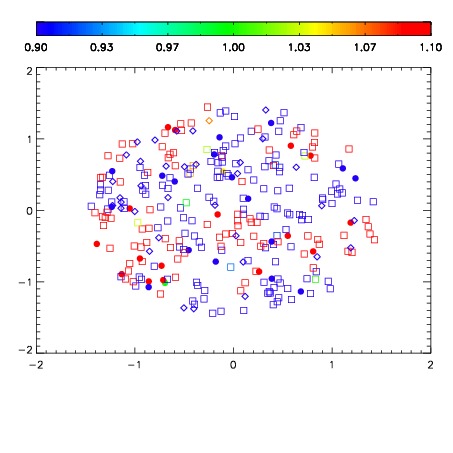
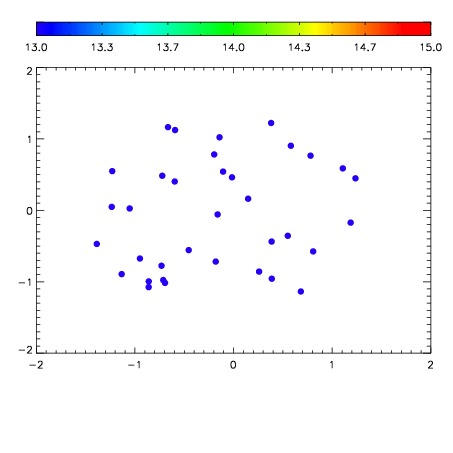

| Frame | Nreads | Zeropoints | Mag plots | Spatial mag deviation | Spatial sky 16325A emission deviations (filled: sky, open: star) | Spatial sky continuum emission | Spatial sky telluric CO2 absorption deviations (filled: H < 10) | |||||||||||||||||||||||
| 0 | 0 |
|
|
|
|
|
|
| IPAIR | NAME | SHIFT | NEWSHIFT | S/N | NAME | SHIFT | NEWSHIFT | S/N |
| 0 | 18550018 | 0.492810 | 0.00000 | 18.9286 | 18550019 | 0.00287549 | 0.489935 | 18.8914 |
| 1 | 18550014 | 0.490836 | 0.00197402 | 19.0868 | 18550012 | 0.00000 | 0.492810 | 19.1258 |
| 2 | 18550013 | 0.490464 | 0.00234601 | 19.0623 | 18550015 | 0.00132641 | 0.491484 | 19.0367 |
| 3 | 18550017 | 0.492499 | 0.000311017 | 18.9681 | 18550016 | 0.000855525 | 0.491954 | 18.9887 |