| Red | Green | Blue | |
| z | 17.64 | ||
| znorm | Inf | ||
| sky | -Inf | -Inf | -NaN |
| S/N | 19.8 | 34.2 | 38.8 |
| S/N(c) | 11.9 | 23.9 | 64.1 |
| SN(E/C) |
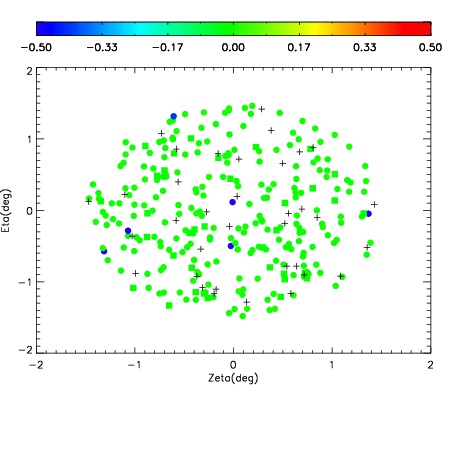


| Frame | Nreads | Zeropoints | Mag plots | Spatial mag deviation | Spatial sky 16325A emission deviations (filled: sky, open: star) | Spatial sky continuum emission | Spatial sky telluric CO2 absorption deviations (filled: H < 10) | |||||||||||||||||||||||
| 0 | 0 |
|
|
|
|
|
|
| IPAIR | NAME | SHIFT | NEWSHIFT | S/N | NAME | SHIFT | NEWSHIFT | S/N |
| 0 | 14940062 | 0.499546 | 0.00000 | 18.7294 | 14940063 | -0.00124722 | 0.500793 | 18.6810 |
| 1 | 14940065 | 0.499298 | 0.000247985 | 18.7808 | 14940067 | -0.00199737 | 0.501543 | 18.7775 |
| 2 | 14940066 | 0.498875 | 0.000670999 | 18.6857 | 14940060 | 0.00000 | 0.499546 | 18.6273 |
| 3 | 14940061 | 0.498679 | 0.000866979 | 18.5865 | 14940064 | -0.00172174 | 0.501268 | 18.5834 |