| Red | Green | Blue | |
| z | 17.64 | ||
| znorm | Inf | ||
| sky | -NaN | -NaN | -NaN |
| S/N | 21.6 | 37.0 | 41.4 |
| S/N(c) | 43.0 | 21.4 | 34.5 |
| SN(E/C) |

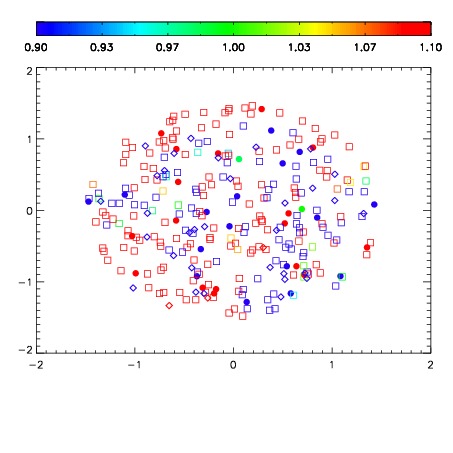


| Frame | Nreads | Zeropoints | Mag plots | Spatial mag deviation | Spatial sky 16325A emission deviations (filled: sky, open: star) | Spatial sky continuum emission | Spatial sky telluric CO2 absorption deviations (filled: H < 10) | |||||||||||||||||||||||
| 0 | 0 |
|
|
|
|
|
|
| IPAIR | NAME | SHIFT | NEWSHIFT | S/N | NAME | SHIFT | NEWSHIFT | S/N |
| 0 | 14980053 | 0.500981 | 0.00000 | 18.9336 | 14980051 | 0.00154650 | 0.499434 | 19.0162 |
| 1 | 14980054 | 0.500531 | 0.000449955 | 18.9301 | 14980055 | 0.00191331 | 0.499068 | 18.9939 |
| 2 | 14980049 | 0.498939 | 0.00204197 | 18.9248 | 14980048 | 0.00000 | 0.500981 | 18.9387 |
| 3 | 14980050 | 0.500264 | 0.000716984 | 18.9200 | 14980052 | 0.00147546 | 0.499506 | 18.8854 |