| Red | Green | Blue | |
| z | 17.64 | ||
| znorm | Inf | ||
| sky | -NaN | -NaN | -NaN |
| S/N | 21.3 | 36.8 | 42.7 |
| S/N(c) | 17.1 | 32.7 | 87.9 |
| SN(E/C) |
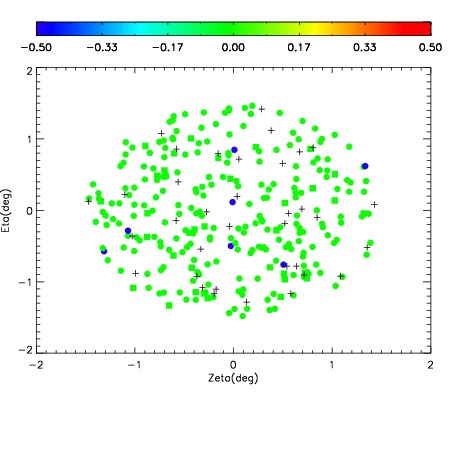
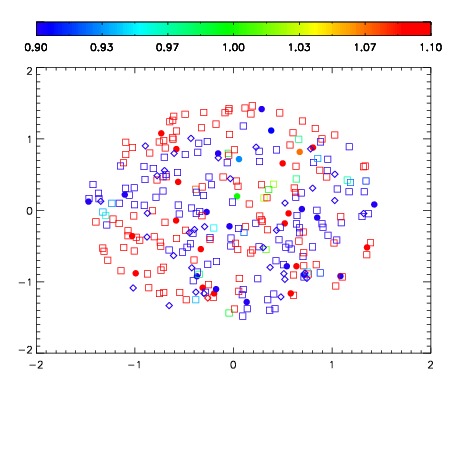


| Frame | Nreads | Zeropoints | Mag plots | Spatial mag deviation | Spatial sky 16325A emission deviations (filled: sky, open: star) | Spatial sky continuum emission | Spatial sky telluric CO2 absorption deviations (filled: H < 10) | |||||||||||||||||||||||
| 0 | 0 |
|
|
|
|
|
|
| IPAIR | NAME | SHIFT | NEWSHIFT | S/N | NAME | SHIFT | NEWSHIFT | S/N |
| 0 | 15010020 | 0.00000 | 0.00000 | 19.1364 | 15010021 | -0.498748 | 0.498748 | 19.1224 |
| 1 | 15010027 | -0.00133122 | 0.00133122 | 19.1927 | 15010026 | -0.498473 | 0.498473 | 19.1987 |
| 2 | 15010023 | -0.000923692 | 0.000923692 | 19.1926 | 15010025 | -0.498865 | 0.498865 | 19.1526 |
| 3 | 15010024 | -0.000990764 | 0.000990764 | 19.1846 | 15010022 | -0.497953 | 0.497953 | 19.1486 |