| Red | Green | Blue | |
| z | 17.63 | ||
| znorm | Inf | ||
| sky | -Inf | -NaN | -NaN |
| S/N | 20.1 | 33.4 | 38.8 |
| S/N(c) | 15.9 | 30.9 | 83.4 |
| SN(E/C) |
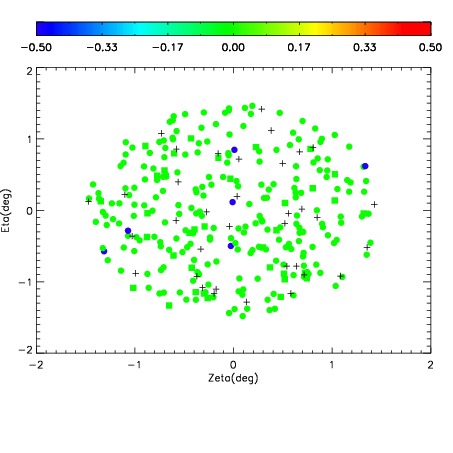

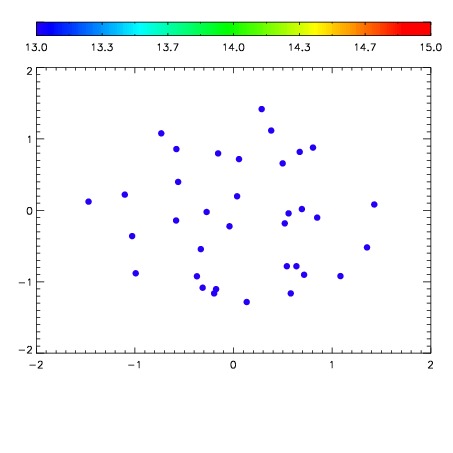

| Frame | Nreads | Zeropoints | Mag plots | Spatial mag deviation | Spatial sky 16325A emission deviations (filled: sky, open: star) | Spatial sky continuum emission | Spatial sky telluric CO2 absorption deviations (filled: H < 10) | |||||||||||||||||||||||
| 0 | 0 |
|
|
|
|
|
|
| IPAIR | NAME | SHIFT | NEWSHIFT | S/N | NAME | SHIFT | NEWSHIFT | S/N |
| 0 | 15020013 | 0.501639 | 0.00000 | 19.0379 | 15020015 | -0.00180377 | 0.503443 | 19.0768 |
| 1 | 15020016 | 0.499897 | 0.00174201 | 19.0330 | 15020014 | -0.000794717 | 0.502434 | 19.0689 |
| 2 | 15020012 | 0.500950 | 0.000689030 | 19.0207 | 15020011 | 0.00000 | 0.501639 | 19.0522 |
| 3 | 15020017 | 0.500461 | 0.00117803 | 18.9001 | 15020018 | 0.00456568 | 0.497073 | 18.9464 |