| Red | Green | Blue | |
| z | 17.64 | ||
| znorm | Inf | ||
| sky | -Inf | -Inf | -NaN |
| S/N | 14.4 | 23.8 | 29.1 |
| S/N(c) | 15.9 | 0.2 | 18.0 |
| SN(E/C) |
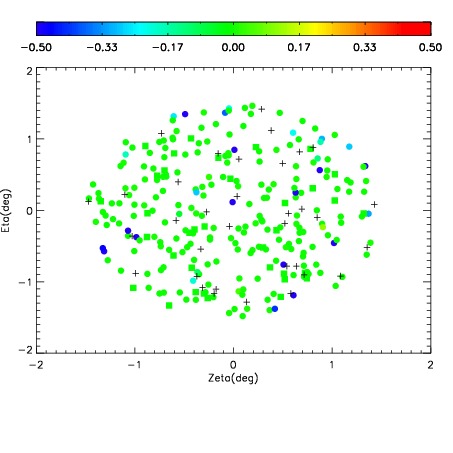
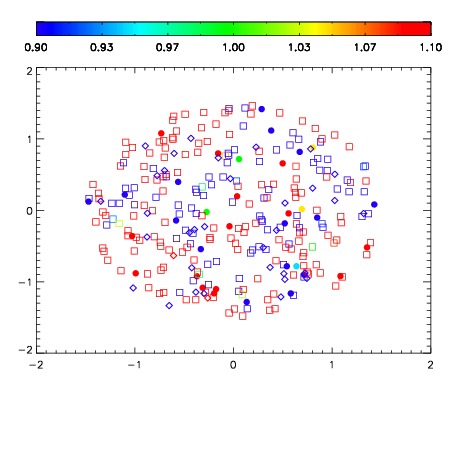


| Frame | Nreads | Zeropoints | Mag plots | Spatial mag deviation | Spatial sky 16325A emission deviations (filled: sky, open: star) | Spatial sky continuum emission | Spatial sky telluric CO2 absorption deviations (filled: H < 10) | |||||||||||||||||||||||
| 0 | 0 |
|
|
|
|
|
|
| IPAIR | NAME | SHIFT | NEWSHIFT | S/N | NAME | SHIFT | NEWSHIFT | S/N |
| 0 | 15170015 | 0.508401 | 0.00000 | 18.8262 | 15170013 | 0.00000 | 0.508401 | 18.9268 |
| 1 | 15170014 | 0.507795 | 0.000606000 | 18.9090 | 15170016 | -6.80566e-05 | 0.508469 | 18.9314 |