| Red | Green | Blue | |
| z | 17.64 | ||
| znorm | Inf | ||
| sky | -Inf | -Inf | -NaN |
| S/N | 17.9 | 30.8 | 35.5 |
| S/N(c) | 35.7 | 23.9 | 22.5 |
| SN(E/C) |


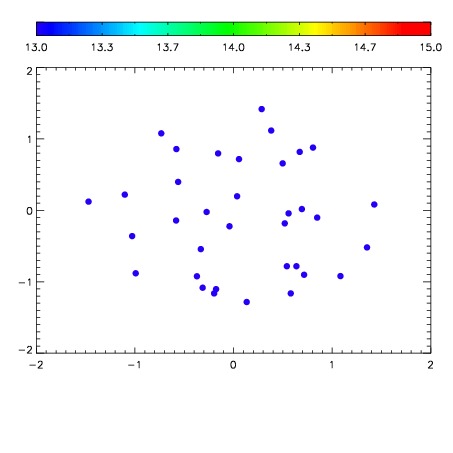

| Frame | Nreads | Zeropoints | Mag plots | Spatial mag deviation | Spatial sky 16325A emission deviations (filled: sky, open: star) | Spatial sky continuum emission | Spatial sky telluric CO2 absorption deviations (filled: H < 10) | |||||||||||||||||||||||
| 0 | 0 |
|
|
|
|
|
|
| IPAIR | NAME | SHIFT | NEWSHIFT | S/N | NAME | SHIFT | NEWSHIFT | S/N |
| 0 | 15250043 | 0.511969 | 0.00000 | 18.5687 | 15250037 | 0.00000 | 0.511969 | 18.5594 |
| 1 | 15250042 | 0.511428 | 0.000540972 | 18.8164 | 15250041 | 0.000827147 | 0.511142 | 18.7570 |
| 2 | 15250038 | 0.509533 | 0.00243598 | 18.6627 | 15250044 | 0.00102598 | 0.510943 | 18.6752 |
| 3 | 15250039 | 0.510808 | 0.00116098 | 18.4565 | 15250040 | 0.000700619 | 0.511268 | 18.5170 |