| Red | Green | Blue | |
| z | 17.64 | ||
| znorm | Inf | ||
| sky | -Inf | -NaN | -NaN |
| S/N | 16.3 | 28.2 | 33.4 |
| S/N(c) | 39.7 | 21.1 | 30.8 |
| SN(E/C) |
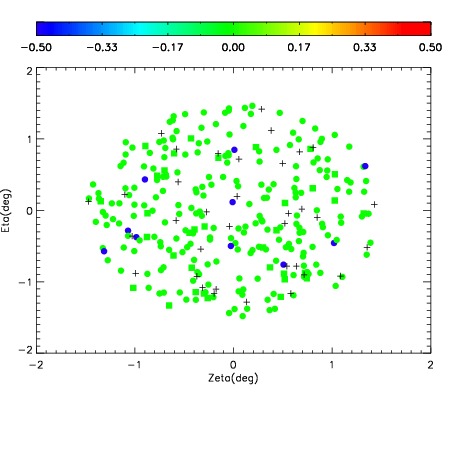
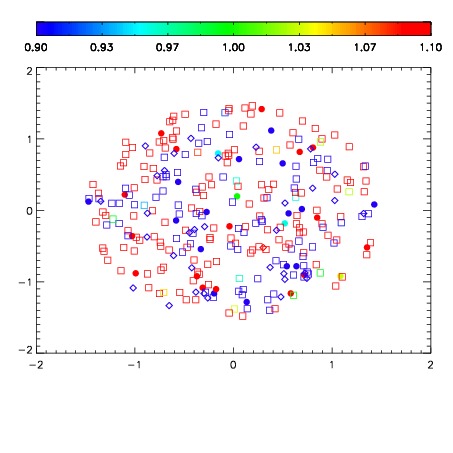
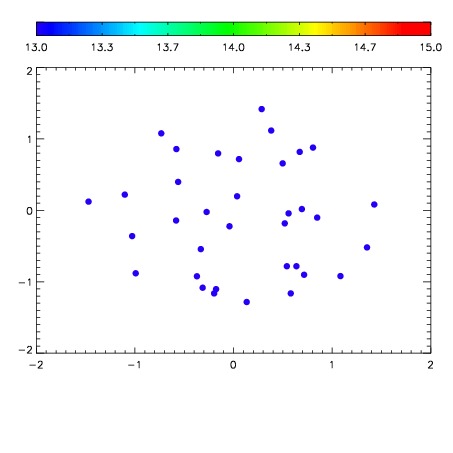

| Frame | Nreads | Zeropoints | Mag plots | Spatial mag deviation | Spatial sky 16325A emission deviations (filled: sky, open: star) | Spatial sky continuum emission | Spatial sky telluric CO2 absorption deviations (filled: H < 10) | |||||||||||||||||||||||
| 0 | 0 |
|
|
|
|
|
|
| IPAIR | NAME | SHIFT | NEWSHIFT | S/N | NAME | SHIFT | NEWSHIFT | S/N |
| 0 | 15290012 | 0.503229 | 0.00000 | 18.5159 | 15290014 | -0.00141551 | 0.504645 | 18.8376 |
| 1 | 15290017 | 0.502538 | 0.000690997 | 19.0645 | 15290015 | -0.000851935 | 0.504081 | 19.0821 |
| 2 | 15290016 | 0.502034 | 0.00119501 | 19.0490 | 15290018 | -0.000858826 | 0.504088 | 19.0772 |
| 3 | 15290013 | 0.503172 | 5.70416e-05 | 18.1322 | 15290011 | 0.00000 | 0.503229 | 18.0091 |