| Red | Green | Blue | |
| z | 17.65 | ||
| znorm | Inf | ||
| sky | -Inf | -Inf | -Inf |
| S/N | 23.5 | 42.9 | 48.7 |
| S/N(c) | 27.1 | 13.9 | 46.0 |
| SN(E/C) |
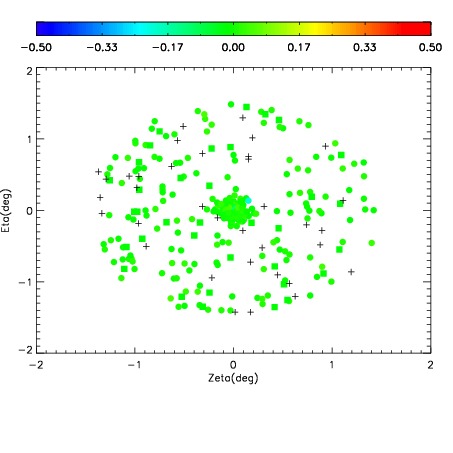
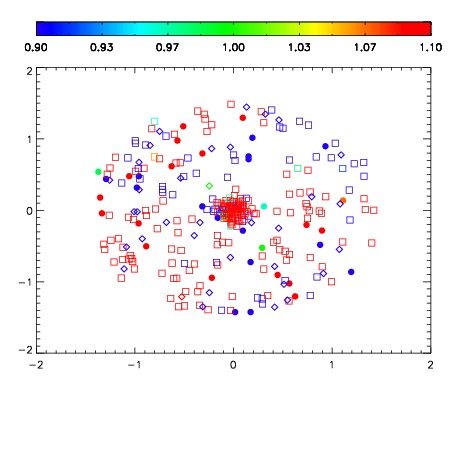
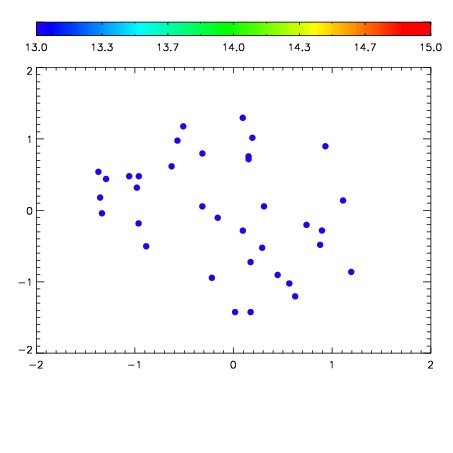

| Frame | Nreads | Zeropoints | Mag plots | Spatial mag deviation | Spatial sky 16325A emission deviations (filled: sky, open: star) | Spatial sky continuum emission | Spatial sky telluric CO2 absorption deviations (filled: H < 10) | |||||||||||||||||||||||
| 0 | 0 |
|
|
|
|
|
|
| IPAIR | NAME | SHIFT | NEWSHIFT | S/N | NAME | SHIFT | NEWSHIFT | S/N |
| 0 | 17030038 | 0.488135 | 0.00000 | 18.9404 | 17030036 | 0.00162804 | 0.486507 | 18.9750 |
| 1 | 17030035 | 0.487004 | 0.00113100 | 18.9814 | 17030037 | 0.00156893 | 0.486566 | 18.9780 |
| 2 | 17030039 | 0.487909 | 0.000226021 | 18.7968 | 17030040 | 0.00448686 | 0.483648 | 18.7242 |
| 3 | 17030034 | 0.487915 | 0.000220001 | 17.7246 | 17030033 | 0.00000 | 0.488135 | 18.3346 |