| Red | Green | Blue | |
| z | 17.64 | ||
| znorm | Inf | ||
| sky | -Inf | -Inf | -NaN |
| S/N | 30.2 | 52.8 | 58.1 |
| S/N(c) | 32.1 | 16.7 | 51.6 |
| SN(E/C) |
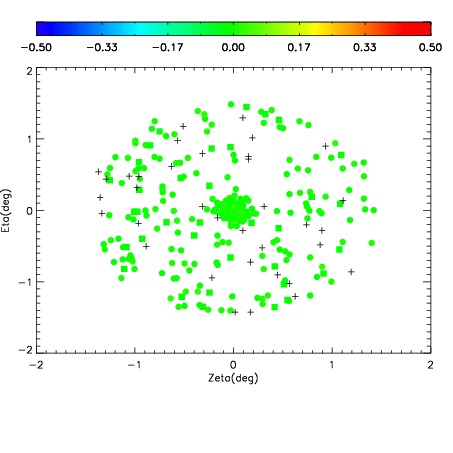
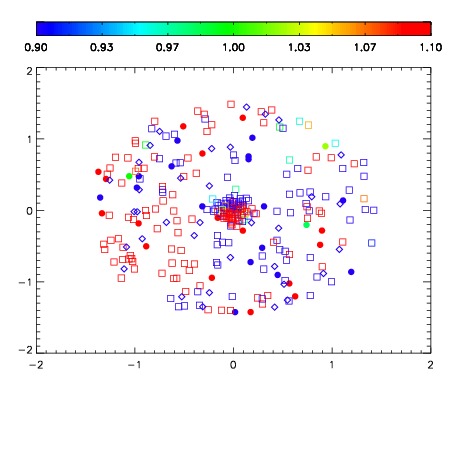


| Frame | Nreads | Zeropoints | Mag plots | Spatial mag deviation | Spatial sky 16325A emission deviations (filled: sky, open: star) | Spatial sky continuum emission | Spatial sky telluric CO2 absorption deviations (filled: H < 10) | |||||||||||||||||||||||
| 0 | 0 |
|
|
|
|
|
|
| IPAIR | NAME | SHIFT | NEWSHIFT | S/N | NAME | SHIFT | NEWSHIFT | S/N |
| 0 | 19940067 | 0.498211 | 0.00000 | 19.0180 | 19940068 | -0.00638631 | 0.504597 | 19.0148 |
| 1 | 19940066 | 0.496943 | 0.00126800 | 19.1062 | 19940065 | 0.00000 | 0.498211 | 19.1244 |
| 2 | 19940070 | 0.496721 | 0.00149000 | 19.0225 | 19940072 | -0.00519718 | 0.503408 | 19.0226 |
| 3 | 19940071 | 0.497919 | 0.000292003 | 18.9454 | 19940069 | -0.00642793 | 0.504639 | 18.9511 |