| Red | Green | Blue | |
| z | 17.65 | ||
| znorm | Inf | ||
| sky | -Inf | -Inf | -NaN |
| S/N | 23.9 | 44.4 | 49.8 |
| S/N(c) | 27.5 | 15.1 | 43.5 |
| SN(E/C) |


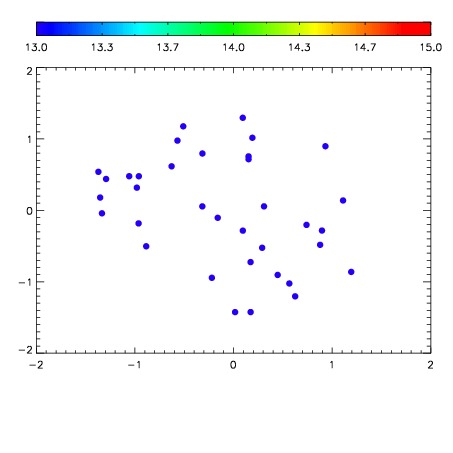

| Frame | Nreads | Zeropoints | Mag plots | Spatial mag deviation | Spatial sky 16325A emission deviations (filled: sky, open: star) | Spatial sky continuum emission | Spatial sky telluric CO2 absorption deviations (filled: H < 10) | |||||||||||||||||||||||
| 0 | 0 |
|
|
|
|
|
|
| IPAIR | NAME | SHIFT | NEWSHIFT | S/N | NAME | SHIFT | NEWSHIFT | S/N |
| 0 | 19970052 | 0.00000 | 0.00000 | 18.6790 | 19970057 | -0.500163 | 0.500163 | 18.7276 |
| 1 | 19970059 | -0.00681014 | 0.00681014 | 18.8235 | 19970058 | -0.500861 | 0.500861 | 18.7929 |
| 2 | 19970055 | -0.00418618 | 0.00418618 | 18.6492 | 19970054 | -0.495581 | 0.495581 | 18.6336 |
| 3 | 19970056 | -0.00395088 | 0.00395088 | 18.6370 | 19970053 | -0.495367 | 0.495367 | 18.6021 |