| Red | Green | Blue | |
| z | 17.64 | ||
| znorm | Inf | ||
| sky | -NaN | -Inf | -NaN |
| S/N | 24.6 | 45.6 | 48.9 |
| S/N(c) | 27.4 | 57.0 | 51.4 |
| SN(E/C) |
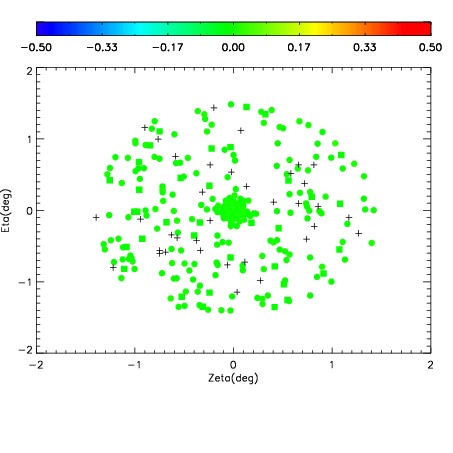
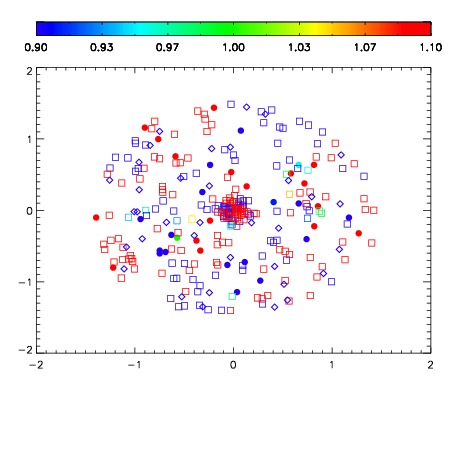


| Frame | Nreads | Zeropoints | Mag plots | Spatial mag deviation | Spatial sky 16325A emission deviations (filled: sky, open: star) | Spatial sky continuum emission | Spatial sky telluric CO2 absorption deviations (filled: H < 10) | |||||||||||||||||||||||
| 0 | 0 |
|
|
|
|
|
|
| IPAIR | NAME | SHIFT | NEWSHIFT | S/N | NAME | SHIFT | NEWSHIFT | S/N |
| 0 | 19980060 | 0.498387 | 0.00000 | 18.8519 | 19980065 | -0.00468603 | 0.503073 | 18.9396 |
| 1 | 19980063 | 0.496796 | 0.00159100 | 18.9407 | 19980062 | -0.00292242 | 0.501309 | 18.9938 |
| 2 | 19980064 | 0.497748 | 0.000639021 | 18.8255 | 19980061 | -0.00311574 | 0.501503 | 18.9005 |
| 3 | 19980059 | 0.497790 | 0.000597000 | 18.7480 | 19980058 | 0.00000 | 0.498387 | 18.6546 |