| Red | Green | Blue | |
| z | 17.64 | ||
| znorm | Inf | ||
| sky | -Inf | -Inf | -Inf |
| S/N | 17.2 | 30.5 | 32.5 |
| S/N(c) | 0.0 | 0.0 | 0.0 |
| SN(E/C) |
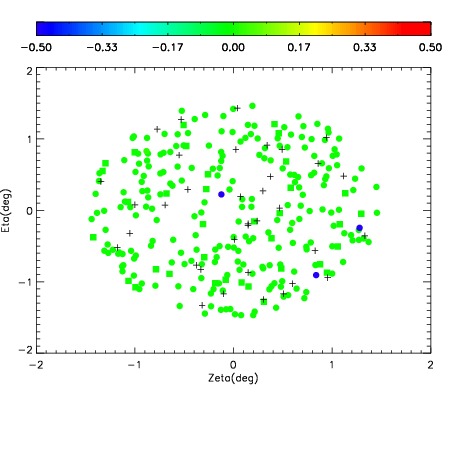
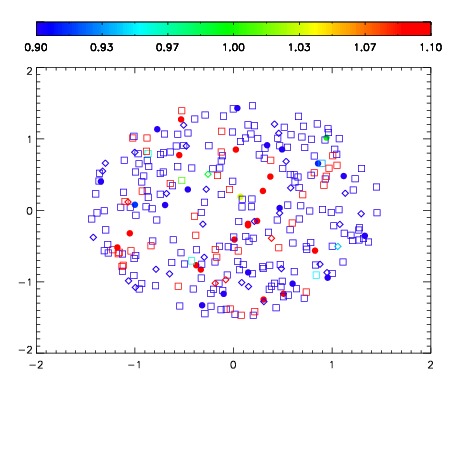
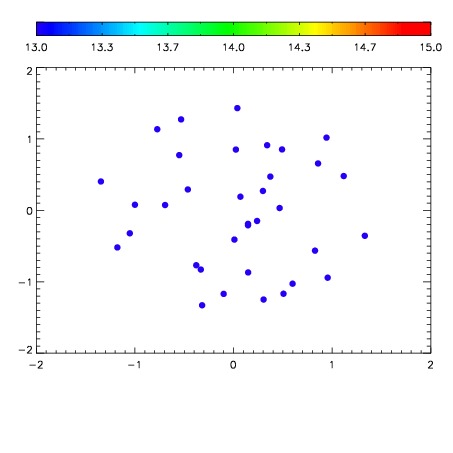

| Frame | Nreads | Zeropoints | Mag plots | Spatial mag deviation | Spatial sky 16325A emission deviations (filled: sky, open: star) | Spatial sky continuum emission | Spatial sky telluric CO2 absorption deviations (filled: H < 10) | |||||||||||||||||||||||
| 0 | 0 |
|
|
|
|
|
|
| IPAIR | NAME | SHIFT | NEWSHIFT | S/N | NAME | SHIFT | NEWSHIFT | S/N |
| 0 | 13920030 | 0.501001 | 0.00000 | 18.1267 | 13920031 | -0.000238986 | 0.501240 | 18.1815 |
| 1 | 13920033 | 0.498875 | 0.00212601 | 18.6681 | 13920032 | -0.00142806 | 0.502429 | 18.6368 |
| 2 | 13920029 | 0.499165 | 0.00183600 | 18.2612 | 13920028 | 0.00000 | 0.501001 | 18.3975 |