| Red | Green | Blue | |
| z | 17.64 | ||
| znorm | Inf | ||
| sky | -Inf | -Inf | -Inf |
| S/N | 18.6 | 32.1 | 35.1 |
| S/N(c) | 0.0 | 0.0 | 0.0 |
| SN(E/C) |
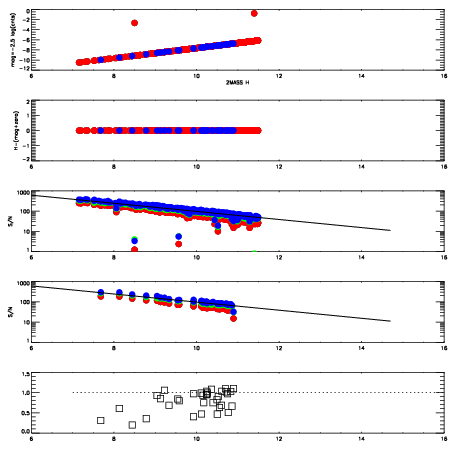
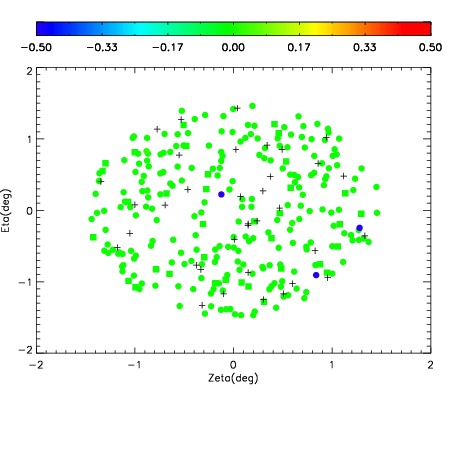
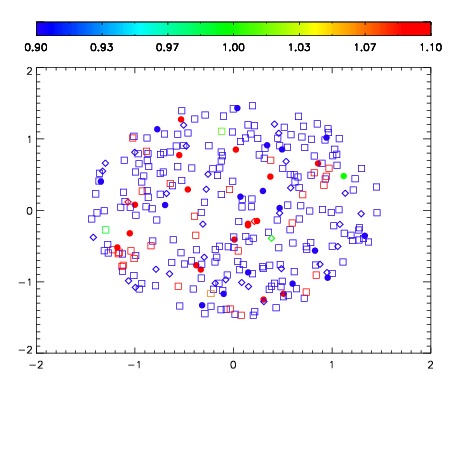
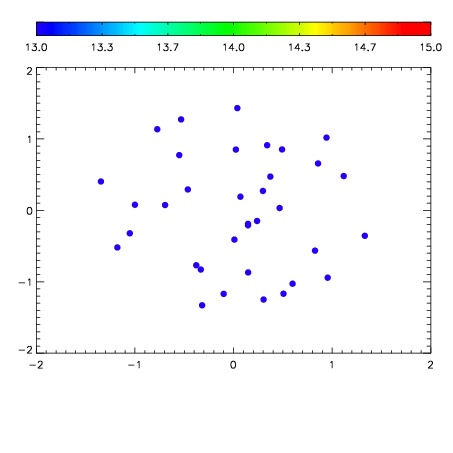

| Frame | Nreads | Zeropoints | Mag plots | Spatial mag deviation | Spatial sky 16325A emission deviations (filled: sky, open: star) | Spatial sky continuum emission | Spatial sky telluric CO2 absorption deviations (filled: H < 10) | |||||||||||||||||||||||
| 0 | 0 |
|
|
|
|
|
|
| IPAIR | NAME | SHIFT | NEWSHIFT | S/N | NAME | SHIFT | NEWSHIFT | S/N |
| 0 | 13930038 | 0.00157453 | 0.00000 | 18.2848 | 13930037 | -0.496572 | 0.498147 | 18.3922 |
| 1 | 13930039 | 0.000554119 | 0.00102041 | 18.7631 | 13930040 | -0.495437 | 0.497012 | 18.6928 |
| 2 | 13930035 | 0.00000 | 0.00157453 | 18.4626 | 13930036 | -0.496255 | 0.497830 | 18.4359 |