| Red | Green | Blue | |
| z | 17.64 | ||
| znorm | Inf | ||
| sky | -Inf | -Inf | -NaN |
| S/N | 25.6 | 44.8 | 47.4 |
| S/N(c) | 0.0 | 0.0 | 0.0 |
| SN(E/C) |
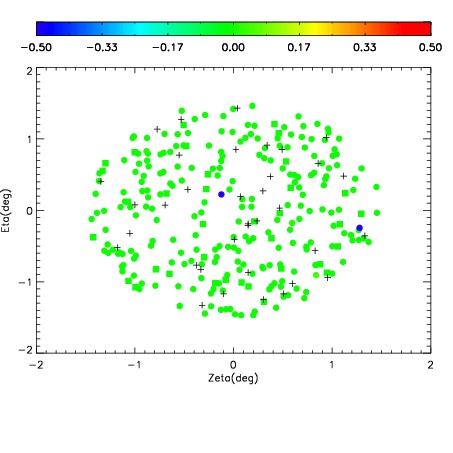
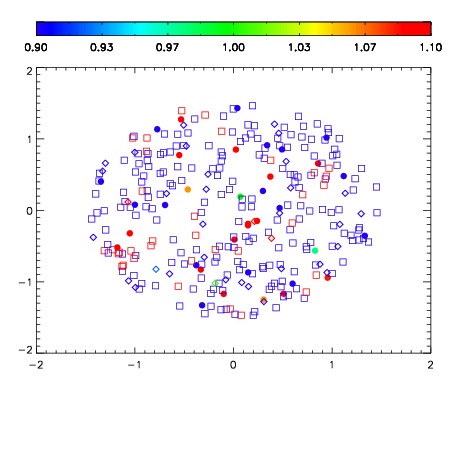
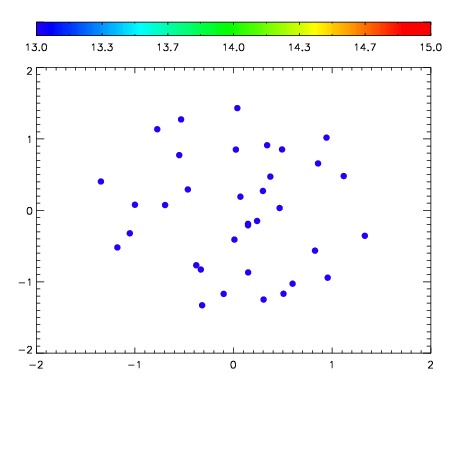

| Frame | Nreads | Zeropoints | Mag plots | Spatial mag deviation | Spatial sky 16325A emission deviations (filled: sky, open: star) | Spatial sky continuum emission | Spatial sky telluric CO2 absorption deviations (filled: H < 10) | |||||||||||||||||||||||
| 0 | 0 |
|
|
|
|
|
|
| IPAIR | NAME | SHIFT | NEWSHIFT | S/N | NAME | SHIFT | NEWSHIFT | S/N |
| 0 | 13940028 | 0.500680 | 0.00000 | 17.9801 | 13940026 | 0.00000 | 0.500680 | 18.2721 |
| 1 | 13940031 | 0.497324 | 0.00335604 | 18.7519 | 13940030 | -0.00122034 | 0.501900 | 18.8009 |
| 2 | 13940036 | 0.497944 | 0.00273603 | 18.7233 | 13940037 | -0.000973284 | 0.501653 | 18.7310 |
| 3 | 13940039 | 0.496935 | 0.00374502 | 18.4719 | 13940038 | -0.00133695 | 0.502017 | 18.4103 |
| 4 | 13940032 | 0.497893 | 0.00278702 | 18.3198 | 13940033 | -0.00195865 | 0.502639 | 18.3298 |
| 5 | 13940027 | 0.499271 | 0.00140902 | 18.2295 | 13940034 | -0.00128430 | 0.501964 | 18.2855 |