| Red | Green | Blue | |
| z | 17.64 | ||
| znorm | Inf | ||
| sky | -Inf | -Inf | -Inf |
| S/N | 10.0 | 20.6 | 21.8 |
| S/N(c) | 0.0 | 0.0 | 0.0 |
| SN(E/C) |
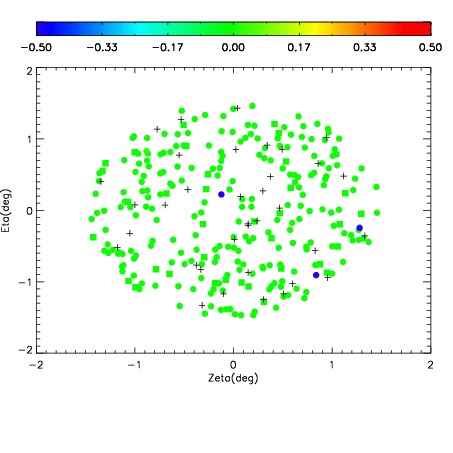
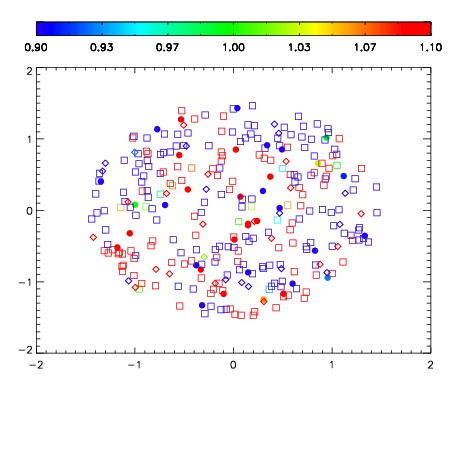


| Frame | Nreads | Zeropoints | Mag plots | Spatial mag deviation | Spatial sky 16325A emission deviations (filled: sky, open: star) | Spatial sky continuum emission | Spatial sky telluric CO2 absorption deviations (filled: H < 10) | |||||||||||||||||||||||
| 0 | 0 |
|
|
|
|
|
|
| IPAIR | NAME | SHIFT | NEWSHIFT | S/N | NAME | SHIFT | NEWSHIFT | S/N |
| 0 | 13950028 | 0.501507 | 0.00000 | 17.2737 | 13950037 | -0.00182328 | 0.503330 | 17.7115 |
| 1 | 13950032 | 0.500682 | 0.000824988 | 17.4352 | 13950038 | -0.00152645 | 0.503033 | 17.7803 |
| 2 | 13950031 | 0.499824 | 0.00168300 | 17.1810 | 13950029 | -0.000608220 | 0.502115 | 17.2509 |
| 3 | 13950036 | 0.500416 | 0.00109100 | 17.1273 | 13950034 | -0.000658380 | 0.502165 | 16.9466 |
| 4 | 13950035 | 0.500131 | 0.00137597 | 16.9041 | 13950033 | -0.000216305 | 0.501723 | 16.7314 |
| 5 | 13950039 | 0.499293 | 0.00221398 | 16.8720 | 13950030 | -5.82924e-05 | 0.501565 | 15.8550 |
| 6 | 13950027 | 0.501066 | 0.000440955 | 16.3553 | 13950026 | 0.00000 | 0.501507 | 15.8008 |