| Red | Green | Blue | |
| z | 17.64 | ||
| znorm | Inf | ||
| sky | -Inf | -Inf | -Inf |
| S/N | 16.7 | 29.2 | 31.8 |
| S/N(c) | 0.0 | 0.0 | 0.0 |
| SN(E/C) |
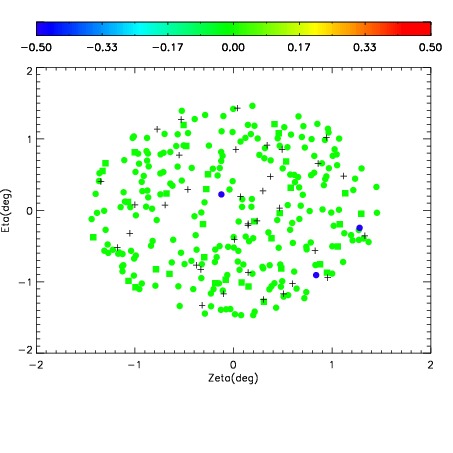
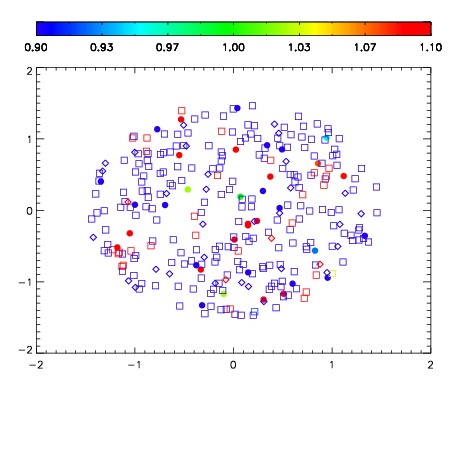
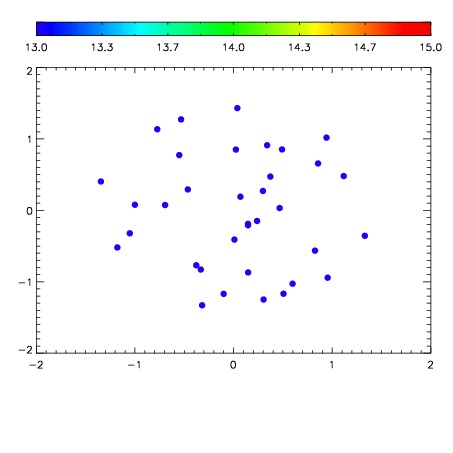

| Frame | Nreads | Zeropoints | Mag plots | Spatial mag deviation | Spatial sky 16325A emission deviations (filled: sky, open: star) | Spatial sky continuum emission | Spatial sky telluric CO2 absorption deviations (filled: H < 10) | |||||||||||||||||||||||
| 0 | 0 |
|
|
|
|
|
|
| IPAIR | NAME | SHIFT | NEWSHIFT | S/N | NAME | SHIFT | NEWSHIFT | S/N |
| 0 | 13960024 | 0.00139650 | 0.00000 | 17.8891 | 13960023 | -0.498896 | 0.500292 | 17.9806 |
| 1 | 13960025 | 0.000587229 | 0.000809271 | 18.8477 | 13960026 | -0.496989 | 0.498386 | 18.8508 |
| 2 | 13960021 | 0.00000 | 0.00139650 | 17.9185 | 13960022 | -0.498793 | 0.500189 | 18.0286 |