| Red | Green | Blue | |
| z | 17.64 | ||
| znorm | Inf | ||
| sky | -Inf | -Inf | -Inf |
| S/N | 38.5 | 62.6 | 71.0 |
| S/N(c) | 0.0 | 0.0 | 0.0 |
| SN(E/C) |
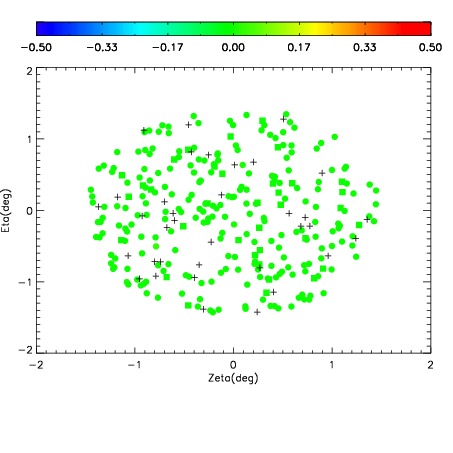

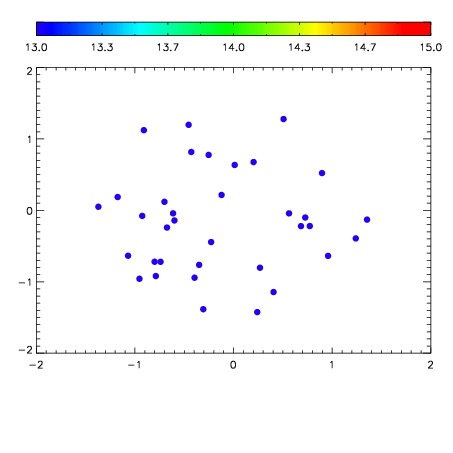

| Frame | Nreads | Zeropoints | Mag plots | Spatial mag deviation | Spatial sky 16325A emission deviations (filled: sky, open: star) | Spatial sky continuum emission | Spatial sky telluric CO2 absorption deviations (filled: H < 10) | |||||||||||||||||||||||
| 0 | 0 |
|
|
|
|
|
|
| IPAIR | NAME | SHIFT | NEWSHIFT | S/N | NAME | SHIFT | NEWSHIFT | S/N |
| 0 | 14160045 | 0.505483 | 0.00000 | 18.4126 | 14160044 | 0.00288058 | 0.502602 | 18.4729 |
| 1 | 14160026 | 0.501291 | 0.00419199 | 18.8153 | 14160027 | -0.00169379 | 0.507177 | 18.8965 |
| 2 | 14160038 | 0.503581 | 0.00190198 | 18.7843 | 14160032 | 0.00422647 | 0.501257 | 18.8122 |
| 3 | 14160046 | 0.505257 | 0.000225961 | 18.6994 | 14160039 | 0.00123790 | 0.504245 | 18.6887 |
| 4 | 14160033 | 0.503627 | 0.00185597 | 18.6856 | 14160047 | 0.00469723 | 0.500786 | 18.6820 |
| 5 | 14160041 | 0.503530 | 0.00195295 | 18.6687 | 14160040 | 0.00131909 | 0.504164 | 18.6122 |
| 6 | 14160042 | 0.504918 | 0.000564992 | 18.4656 | 14160043 | 0.00365813 | 0.501825 | 18.6081 |
| 7 | 14160030 | 0.503388 | 0.00209498 | 18.2802 | 14160035 | 0.00113086 | 0.504352 | 18.2795 |
| 8 | 14160037 | 0.503128 | 0.00235498 | 18.1719 | 14160036 | 0.00126005 | 0.504223 | 18.2650 |
| 9 | 14160034 | 0.504639 | 0.000843942 | 18.1233 | 14160031 | 0.00392770 | 0.501555 | 18.2144 |
| 10 | 14160025 | 0.501896 | 0.00358695 | 18.0453 | 14160028 | -0.000730723 | 0.506214 | 17.9877 |
| 11 | 14160029 | 0.502263 | 0.00321996 | 17.9976 | 14160024 | 0.00000 | 0.505483 | 17.9030 |