| Red | Green | Blue | |
| z | 17.64 | ||
| znorm | Inf | ||
| sky | -Inf | -Inf | -NaN |
| S/N | 31.2 | 54.3 | 60.0 |
| S/N(c) | 0.0 | 0.0 | 0.0 |
| SN(E/C) |
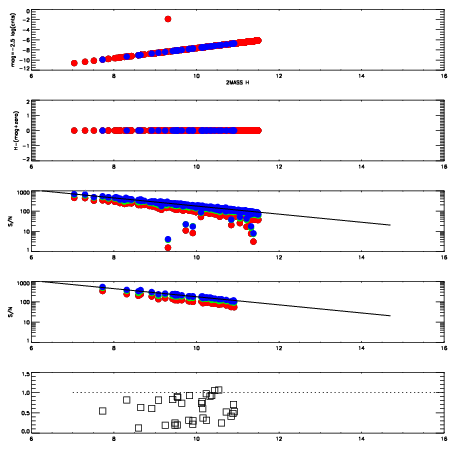
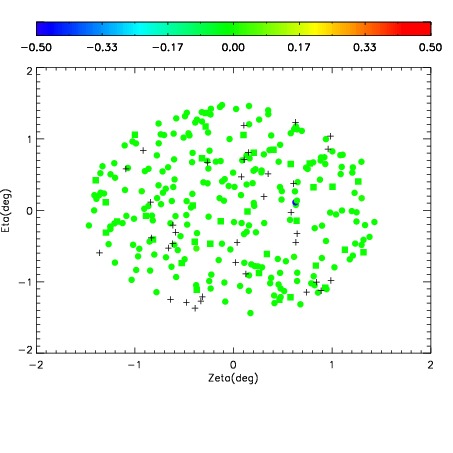
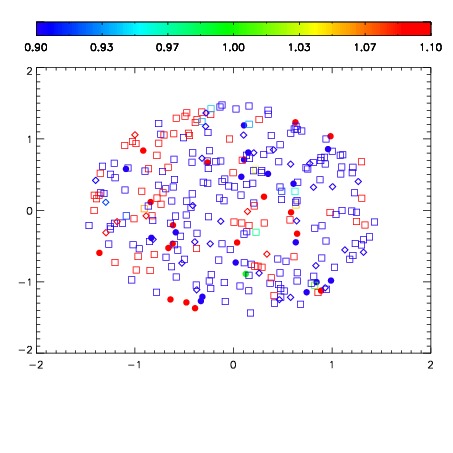
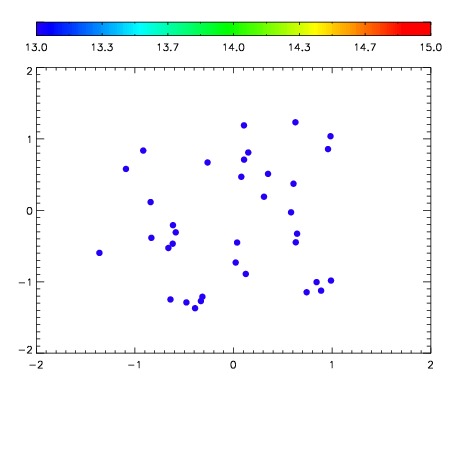

| Frame | Nreads | Zeropoints | Mag plots | Spatial mag deviation | Spatial sky 16325A emission deviations (filled: sky, open: star) | Spatial sky continuum emission | Spatial sky telluric CO2 absorption deviations (filled: H < 10) | |||||||||||||||||||||||
| 0 | 0 |
|
|
|
|
|
|
| IPAIR | NAME | SHIFT | NEWSHIFT | S/N | NAME | SHIFT | NEWSHIFT | S/N |
| 0 | 14170036 | 0.00444177 | 0.00000 | 18.0768 | 14170037 | -0.498429 | 0.502871 | 18.1512 |
| 1 | 14170027 | 0.00248731 | 0.00195446 | 18.6510 | 14170033 | -0.496226 | 0.500668 | 18.6007 |
| 2 | 14170032 | 0.00320218 | 0.00123959 | 18.6140 | 14170026 | -0.496491 | 0.500933 | 18.5591 |
| 3 | 14170035 | 0.00360680 | 0.000834970 | 18.4709 | 14170025 | -0.496740 | 0.501182 | 18.5382 |
| 4 | 14170028 | 0.00376720 | 0.000674570 | 18.4118 | 14170034 | -0.497340 | 0.501782 | 18.4535 |
| 5 | 14170024 | 0.000521578 | 0.00392019 | 18.4088 | 14170029 | -0.496886 | 0.501328 | 18.4374 |
| 6 | 14170031 | 0.00252288 | 0.00191889 | 18.3597 | 14170021 | -0.500127 | 0.504569 | 18.4014 |
| 7 | 14170020 | 0.00000 | 0.00444177 | 18.2507 | 14170030 | -0.496924 | 0.501366 | 18.3398 |
| 8 | 14170023 | 0.000225288 | 0.00421648 | 18.1752 | 14170022 | -0.500847 | 0.505289 | 18.1729 |