| Red | Green | Blue | |
| z | 17.64 | ||
| znorm | Inf | ||
| sky | -Inf | -NaN | -NaN |
| S/N | 15.9 | 28.1 | 30.9 |
| S/N(c) | 0.0 | 0.0 | 0.0 |
| SN(E/C) |
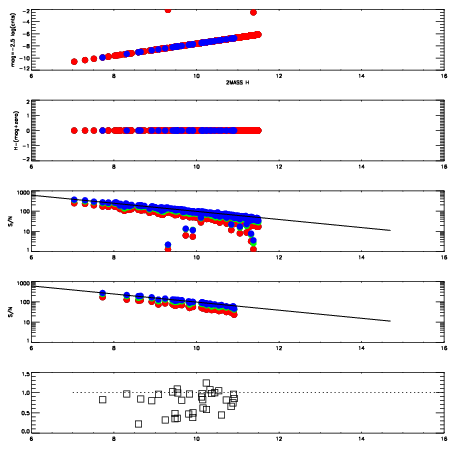
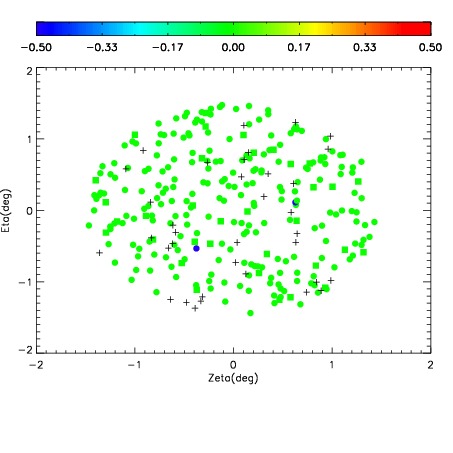
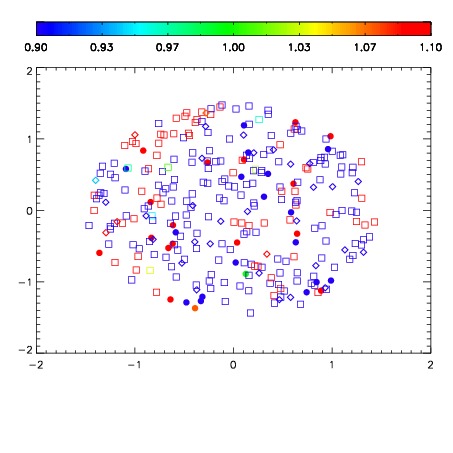
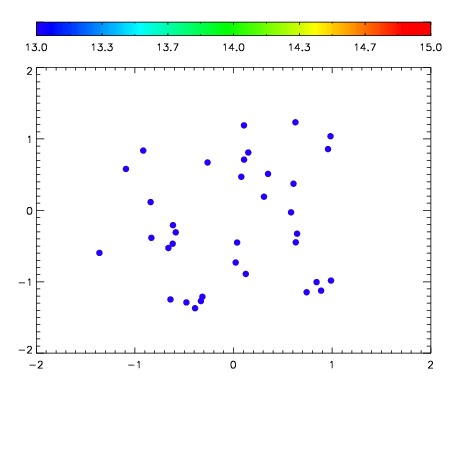

| Frame | Nreads | Zeropoints | Mag plots | Spatial mag deviation | Spatial sky 16325A emission deviations (filled: sky, open: star) | Spatial sky continuum emission | Spatial sky telluric CO2 absorption deviations (filled: H < 10) | |||||||||||||||||||||||
| 0 | 0 |
|
|
|
|
|
|
| IPAIR | NAME | SHIFT | NEWSHIFT | S/N | NAME | SHIFT | NEWSHIFT | S/N |
| 0 | 14190021 | 0.502365 | 0.00000 | 18.7273 | 14190020 | -0.000128949 | 0.502494 | 18.7339 |
| 1 | 14190018 | 0.502181 | 0.000184000 | 17.8117 | 14190016 | 0.00000 | 0.502365 | 17.9382 |
| 2 | 14190017 | 0.501490 | 0.000874996 | 17.7446 | 14190019 | 0.000757144 | 0.501608 | 17.7628 |