| Red | Green | Blue | |
| z | 17.64 | ||
| znorm | Inf | ||
| sky | -Inf | -Inf | -Inf |
| S/N | 31.8 | 55.9 | 63.2 |
| S/N(c) | 0.0 | 0.0 | 0.0 |
| SN(E/C) |
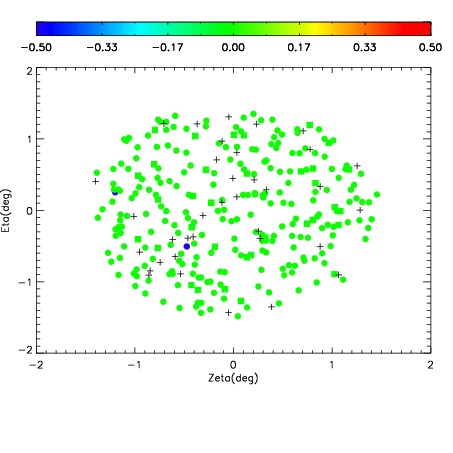

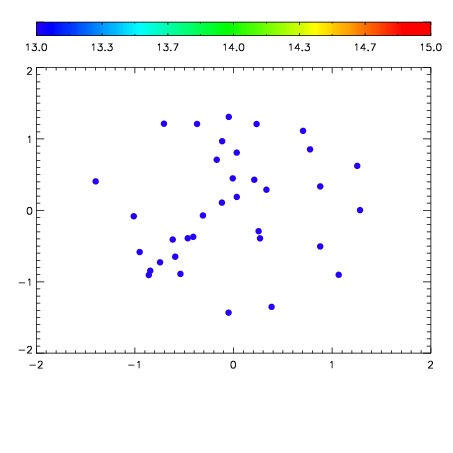

| Frame | Nreads | Zeropoints | Mag plots | Spatial mag deviation | Spatial sky 16325A emission deviations (filled: sky, open: star) | Spatial sky continuum emission | Spatial sky telluric CO2 absorption deviations (filled: H < 10) | |||||||||||||||||||||||
| 0 | 0 |
|
|
|
|
|
|
| IPAIR | NAME | SHIFT | NEWSHIFT | S/N | NAME | SHIFT | NEWSHIFT | S/N |
| 0 | 14180063 | 0.00204115 | 0.00000 | 18.6179 | 14180064 | -0.499687 | 0.501728 | 18.5816 |
| 1 | 14180062 | 0.00133226 | 0.000708890 | 18.5089 | 14180048 | -0.501002 | 0.503043 | 18.5653 |
| 2 | 14180054 | 0.00127150 | 0.000769650 | 18.4609 | 14180053 | -0.500380 | 0.502421 | 18.5145 |
| 3 | 14180047 | -3.30480e-05 | 0.00207420 | 18.4113 | 14180061 | -0.498069 | 0.500110 | 18.4967 |
| 4 | 14180055 | 0.00176334 | 0.000277810 | 18.3661 | 14180057 | -0.500858 | 0.502899 | 18.3482 |
| 5 | 14180058 | 0.00101212 | 0.00102903 | 18.3470 | 14180056 | -0.500770 | 0.502811 | 18.3258 |
| 6 | 14180050 | 0.000564517 | 0.00147663 | 18.2797 | 14180052 | -0.500135 | 0.502176 | 18.2932 |
| 7 | 14180059 | 0.00159657 | 0.000444580 | 18.2499 | 14180049 | -0.500804 | 0.502845 | 18.2670 |
| 8 | 14180051 | 0.00161853 | 0.000422620 | 18.2458 | 14180060 | -0.498026 | 0.500067 | 18.2502 |
| 9 | 14180046 | -0.000552426 | 0.00259358 | 18.1099 | 14180044 | -0.500800 | 0.502841 | 18.1227 |
| 10 | 14180043 | 0.00000 | 0.00204115 | 18.0401 | 14180045 | -0.500864 | 0.502905 | 18.0427 |