| Red | Green | Blue | |
| z | 17.64 | ||
| znorm | Inf | ||
| sky | -Inf | -Inf | -NaN |
| S/N | 20.6 | 36.4 | 40.4 |
| S/N(c) | 0.0 | 0.0 | 0.0 |
| SN(E/C) |
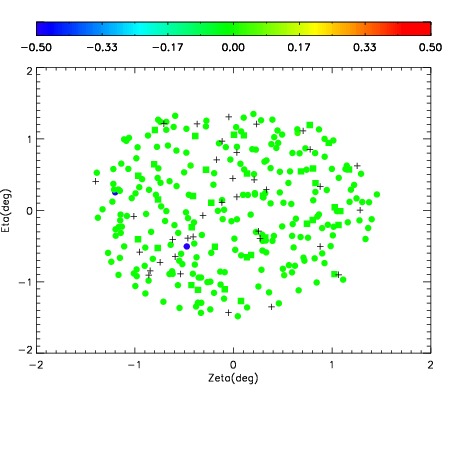
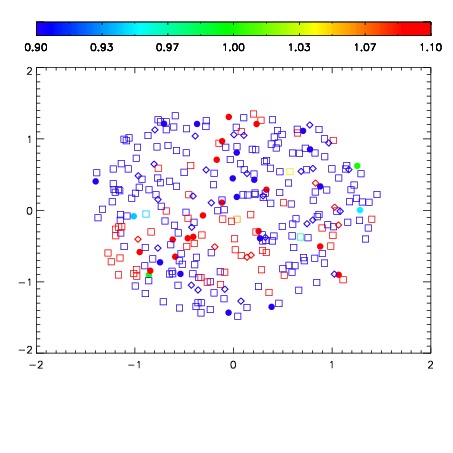


| Frame | Nreads | Zeropoints | Mag plots | Spatial mag deviation | Spatial sky 16325A emission deviations (filled: sky, open: star) | Spatial sky continuum emission | Spatial sky telluric CO2 absorption deviations (filled: H < 10) | |||||||||||||||||||||||
| 0 | 0 |
|
|
|
|
|
|
| IPAIR | NAME | SHIFT | NEWSHIFT | S/N | NAME | SHIFT | NEWSHIFT | S/N |
| 0 | 14190029 | 0.00170133 | 0.00000 | 18.1618 | 14190027 | -0.500947 | 0.502648 | 18.2338 |
| 1 | 14190032 | 0.00142243 | 0.000278900 | 18.6687 | 14190031 | -0.500069 | 0.501770 | 18.7176 |
| 2 | 14190025 | 0.00000 | 0.00170133 | 18.6454 | 14190026 | -0.501820 | 0.503521 | 18.7063 |
| 3 | 14190028 | 0.000568615 | 0.00113272 | 18.3015 | 14190030 | -0.500630 | 0.502331 | 18.2387 |