| Red | Green | Blue | |
| z | 17.64 | ||
| znorm | Inf | ||
| sky | -Inf | -Inf | -NaN |
| S/N | 34.5 | 58.9 | 65.9 |
| S/N(c) | 0.0 | 0.0 | 0.0 |
| SN(E/C) |
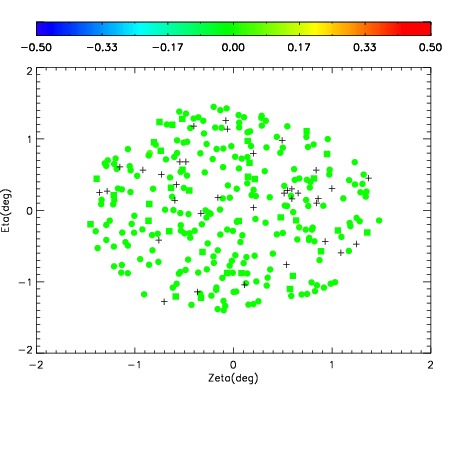
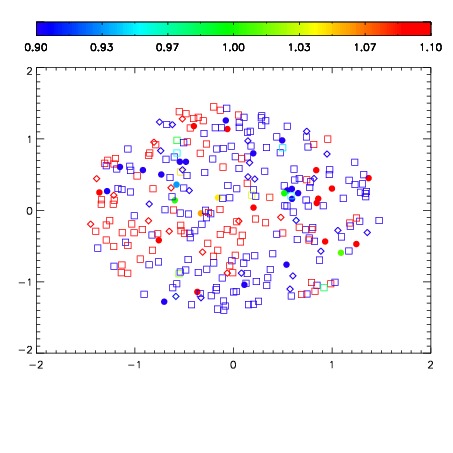
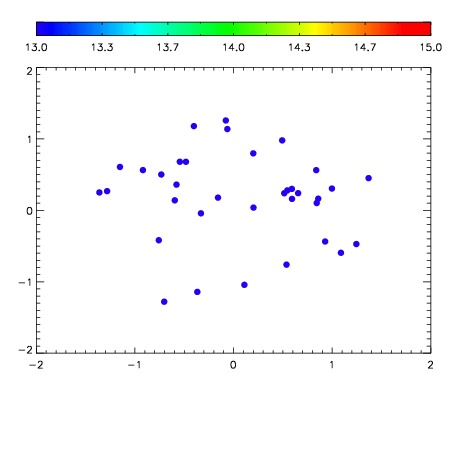

| Frame | Nreads | Zeropoints | Mag plots | Spatial mag deviation | Spatial sky 16325A emission deviations (filled: sky, open: star) | Spatial sky continuum emission | Spatial sky telluric CO2 absorption deviations (filled: H < 10) | |||||||||||||||||||||||
| 0 | 0 |
|
|
|
|
|
|
| IPAIR | NAME | SHIFT | NEWSHIFT | S/N | NAME | SHIFT | NEWSHIFT | S/N |
| 0 | 14260081 | 0.506878 | 0.00000 | 18.0532 | 14260062 | 0.00129697 | 0.505581 | 17.9955 |
| 1 | 14260077 | 0.504048 | 0.00283003 | 18.6730 | 14260078 | 0.00435530 | 0.502523 | 18.6679 |
| 2 | 14260072 | 0.503838 | 0.00304002 | 18.6576 | 14260071 | 0.00301260 | 0.503865 | 18.5724 |
| 3 | 14260065 | 0.503815 | 0.00306302 | 18.5969 | 14260079 | 0.00476790 | 0.502110 | 18.5564 |
| 4 | 14260080 | 0.506170 | 0.000708044 | 18.5541 | 14260066 | 0.00250077 | 0.504377 | 18.5337 |
| 5 | 14260076 | 0.503718 | 0.00316000 | 18.4729 | 14260063 | 0.000783549 | 0.506094 | 18.5038 |
| 6 | 14260073 | 0.504474 | 0.00240403 | 18.4286 | 14260070 | 0.00294430 | 0.503934 | 18.4503 |
| 7 | 14260068 | 0.502910 | 0.00396800 | 18.4226 | 14260074 | 0.00224365 | 0.504634 | 18.3829 |
| 8 | 14260064 | 0.503163 | 0.00371504 | 18.3350 | 14260067 | 0.00258764 | 0.504290 | 18.2718 |
| 9 | 14260060 | 0.502572 | 0.00430602 | 18.2899 | 14260075 | 0.00289763 | 0.503980 | 18.1591 |
| 10 | 14260069 | 0.503522 | 0.00335604 | 18.2454 | 14260059 | 0.00000 | 0.506878 | 18.1574 |
| 11 | 14260061 | 0.503069 | 0.00380903 | 18.0939 | 14260082 | 0.00354371 | 0.503334 | 18.1018 |