| Red | Green | Blue | |
| z | 17.64 | ||
| znorm | Inf | ||
| sky | -NaN | -Inf | -NaN |
| S/N | 32.9 | 57.6 | 64.9 |
| S/N(c) | 0.0 | 0.0 | 0.0 |
| SN(E/C) |
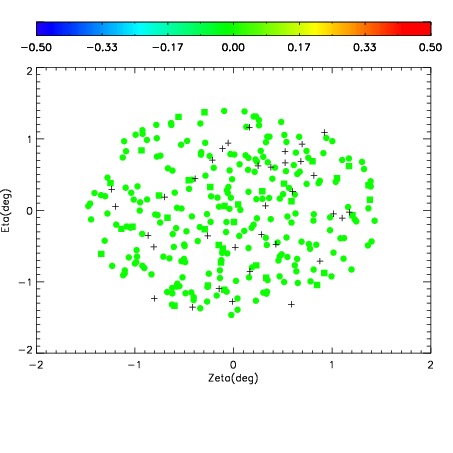
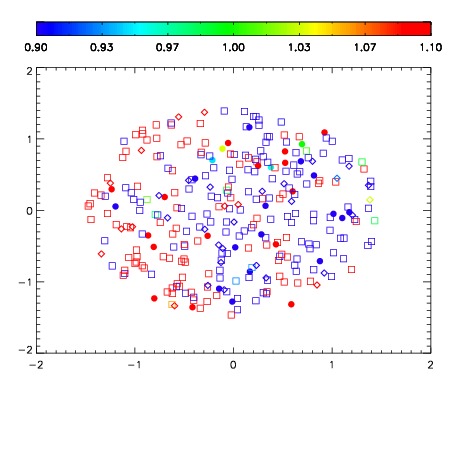
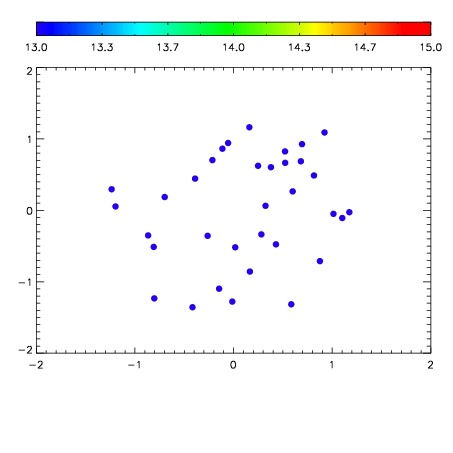

| Frame | Nreads | Zeropoints | Mag plots | Spatial mag deviation | Spatial sky 16325A emission deviations (filled: sky, open: star) | Spatial sky continuum emission | Spatial sky telluric CO2 absorption deviations (filled: H < 10) | |||||||||||||||||||||||
| 0 | 0 |
|
|
|
|
|
|
| IPAIR | NAME | SHIFT | NEWSHIFT | S/N | NAME | SHIFT | NEWSHIFT | S/N |
| 0 | 14220045 | 0.503784 | 0.00000 | 17.8605 | 14220046 | 0.000924318 | 0.502860 | 17.8876 |
| 1 | 14220048 | 0.501769 | 0.00201499 | 18.4319 | 14220047 | 0.000449186 | 0.503335 | 18.5410 |
| 2 | 14220053 | 0.502247 | 0.00153702 | 18.4273 | 14220054 | 0.00141817 | 0.502366 | 18.3962 |
| 3 | 14220061 | 0.501671 | 0.00211298 | 18.3430 | 14220055 | 0.00107375 | 0.502710 | 18.2692 |
| 4 | 14220068 | 0.500466 | 0.00331801 | 18.2200 | 14220050 | 0.000899178 | 0.502885 | 18.2116 |
| 5 | 14220049 | 0.503107 | 0.000676990 | 18.1989 | 14220070 | 0.00239947 | 0.501385 | 18.2081 |
| 6 | 14220056 | 0.500774 | 0.00300997 | 18.1783 | 14220063 | 0.00186676 | 0.501917 | 18.2041 |
| 7 | 14220052 | 0.501812 | 0.00197202 | 18.1672 | 14220067 | 0.00151868 | 0.502265 | 18.1955 |
| 8 | 14220069 | 0.501277 | 0.00250697 | 18.1589 | 14220062 | 0.00182169 | 0.501962 | 18.1917 |
| 9 | 14220064 | 0.501761 | 0.00202298 | 18.1545 | 14220051 | 0.00132628 | 0.502458 | 18.1741 |
| 10 | 14220057 | 0.501790 | 0.00199401 | 18.1515 | 14220058 | 0.00164987 | 0.502134 | 18.1511 |
| 11 | 14220060 | 0.501558 | 0.00222600 | 18.0017 | 14220059 | 0.00195872 | 0.501825 | 18.1058 |
| 12 | 14220065 | 0.502355 | 0.00142902 | 17.8761 | 14220043 | 0.00000 | 0.503784 | 18.0356 |
| 13 | 14220044 | 0.502124 | 0.00165999 | 17.8679 | 14220066 | 0.00196945 | 0.501815 | 17.9449 |
| 14 | 14220072 | 0.501167 | 0.00261700 | 17.7887 | 14220071 | 0.00172145 | 0.502063 | 17.7745 |