| Red | Green | Blue | |
| z | 17.64 | ||
| znorm | Inf | ||
| sky | -Inf | -Inf | -Inf |
| S/N | 21.9 | 36.2 | 41.3 |
| S/N(c) | 0.0 | 0.0 | 0.0 |
| SN(E/C) |
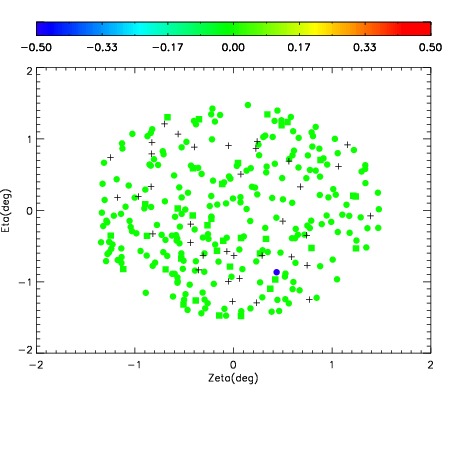
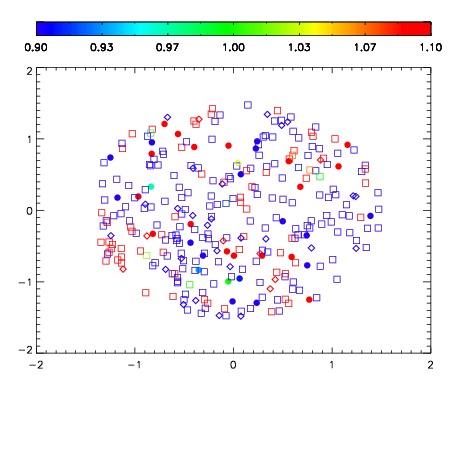
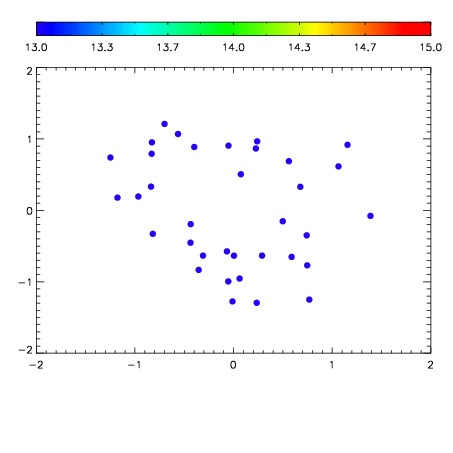

| Frame | Nreads | Zeropoints | Mag plots | Spatial mag deviation | Spatial sky 16325A emission deviations (filled: sky, open: star) | Spatial sky continuum emission | Spatial sky telluric CO2 absorption deviations (filled: H < 10) | |||||||||||||||||||||||
| 0 | 0 |
|
|
|
|
|
|
| IPAIR | NAME | SHIFT | NEWSHIFT | S/N | NAME | SHIFT | NEWSHIFT | S/N |
| 0 | 13960039 | 0.499675 | 0.00000 | 18.3254 | 13960033 | -0.000506371 | 0.500181 | 18.3941 |
| 1 | 13960035 | 0.497434 | 0.00224102 | 18.9326 | 13960034 | -0.00106140 | 0.500736 | 18.9625 |
| 2 | 13960031 | 0.498113 | 0.00156200 | 18.4549 | 13960037 | 0.000203811 | 0.499471 | 18.5133 |
| 3 | 13960032 | 0.499076 | 0.000598997 | 18.3554 | 13960030 | 0.00000 | 0.499675 | 18.4294 |