| Red | Green | Blue | |
| z | 17.64 | ||
| znorm | Inf | ||
| sky | -Inf | -NaN | -NaN |
| S/N | 31.1 | 52.6 | 60.4 |
| S/N(c) | 0.0 | 0.0 | 0.0 |
| SN(E/C) |
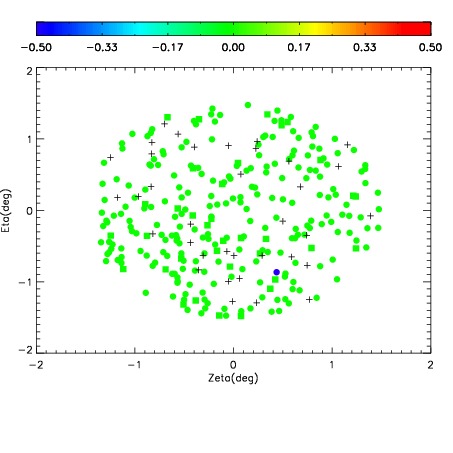
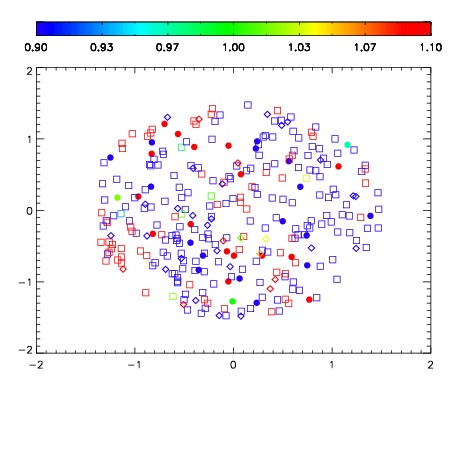


| Frame | Nreads | Zeropoints | Mag plots | Spatial mag deviation | Spatial sky 16325A emission deviations (filled: sky, open: star) | Spatial sky continuum emission | Spatial sky telluric CO2 absorption deviations (filled: H < 10) | |||||||||||||||||||||||
| 0 | 0 |
|
|
|
|
|
|
| IPAIR | NAME | SHIFT | NEWSHIFT | S/N | NAME | SHIFT | NEWSHIFT | S/N |
| 0 | 13970036 | 0.505742 | 0.00000 | 18.5073 | 13970037 | 0.00604299 | 0.499699 | 18.4865 |
| 1 | 13970027 | 0.501295 | 0.00444704 | 18.9268 | 13970026 | 0.00295767 | 0.502784 | 18.9055 |
| 2 | 13970032 | 0.504395 | 0.00134701 | 18.8675 | 13970033 | 0.00556390 | 0.500178 | 18.8661 |
| 3 | 13970035 | 0.504939 | 0.000802994 | 18.7953 | 13970034 | 0.00612798 | 0.499614 | 18.8188 |
| 4 | 13970039 | 0.505339 | 0.000402987 | 18.3372 | 13970029 | 0.00443542 | 0.501307 | 18.3724 |
| 5 | 13970031 | 0.504485 | 0.00125700 | 18.2673 | 13970038 | 0.00636925 | 0.499373 | 18.3580 |
| 6 | 13970028 | 0.502849 | 0.00289303 | 18.1826 | 13970030 | 0.00565744 | 0.500085 | 18.2259 |
| 7 | 13970023 | 0.499815 | 0.00592703 | 18.1115 | 13970022 | 0.00000 | 0.505742 | 18.0685 |
| 8 | 13970024 | 0.501915 | 0.00382704 | 18.0097 | 13970025 | 0.00353289 | 0.502209 | 18.0516 |