| Red | Green | Blue | |
| z | 17.64 | ||
| znorm | Inf | ||
| sky | -NaN | -Inf | -NaN |
| S/N | 26.0 | 46.1 | 51.4 |
| S/N(c) | 0.0 | 0.0 | 0.0 |
| SN(E/C) |
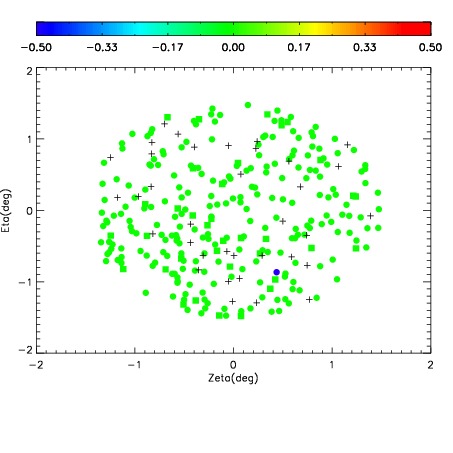
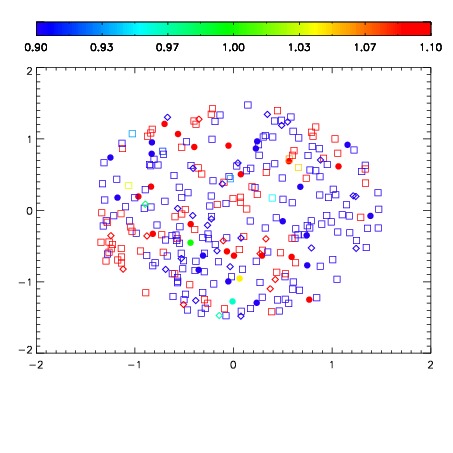


| Frame | Nreads | Zeropoints | Mag plots | Spatial mag deviation | Spatial sky 16325A emission deviations (filled: sky, open: star) | Spatial sky continuum emission | Spatial sky telluric CO2 absorption deviations (filled: H < 10) | |||||||||||||||||||||||
| 0 | 0 |
|
|
|
|
|
|
| IPAIR | NAME | SHIFT | NEWSHIFT | S/N | NAME | SHIFT | NEWSHIFT | S/N |
| 0 | 13980039 | 0.00646017 | 0.00000 | 18.2208 | 13980038 | -0.492302 | 0.498762 | 18.2649 |
| 1 | 13980028 | 0.00305543 | 0.00340474 | 18.7020 | 13980034 | -0.492410 | 0.498870 | 18.6880 |
| 2 | 13980032 | 0.00440596 | 0.00205421 | 18.3015 | 13980029 | -0.493631 | 0.500091 | 18.6517 |
| 3 | 13980036 | 0.00624780 | 0.000212370 | 18.3003 | 13980037 | -0.492801 | 0.499261 | 18.4353 |
| 4 | 13980035 | 0.00508385 | 0.00137632 | 18.2603 | 13980033 | -0.492229 | 0.498689 | 18.2920 |
| 5 | 13980031 | 0.00350445 | 0.00295572 | 18.1846 | 13980030 | -0.493456 | 0.499916 | 18.2229 |
| 6 | 13980024 | 0.00000 | 0.00646017 | 18.1306 | 13980026 | -0.496775 | 0.503235 | 18.0518 |
| 7 | 13980027 | 0.00301033 | 0.00344984 | 18.0705 | 13980025 | -0.496813 | 0.503273 | 17.9179 |