| Red | Green | Blue | |
| z | 17.64 | ||
| znorm | Inf | ||
| sky | -Inf | -Inf | -NaN |
| S/N | 25.8 | 49.3 | 54.1 |
| S/N(c) | 0.0 | 0.0 | 0.0 |
| SN(E/C) |
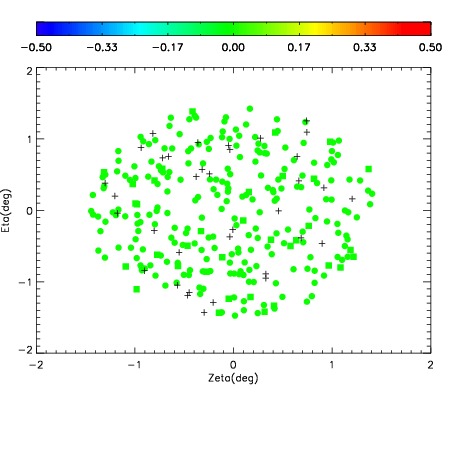
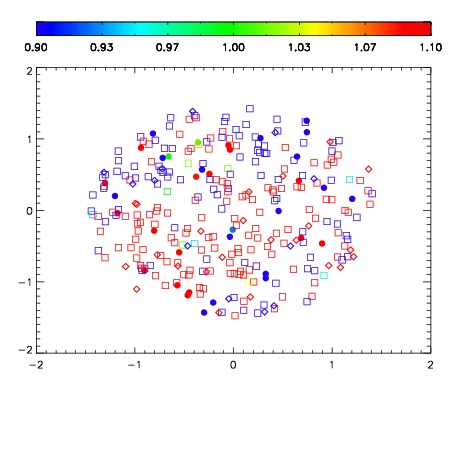
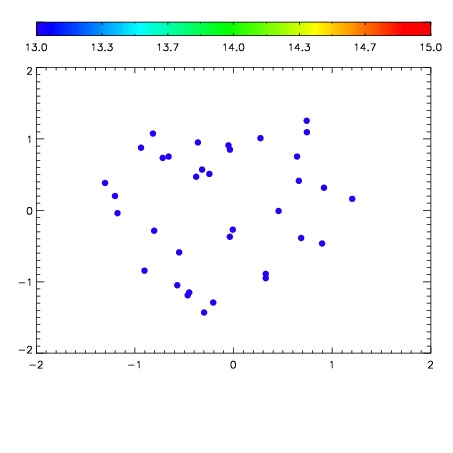

| Frame | Nreads | Zeropoints | Mag plots | Spatial mag deviation | Spatial sky 16325A emission deviations (filled: sky, open: star) | Spatial sky continuum emission | Spatial sky telluric CO2 absorption deviations (filled: H < 10) | |||||||||||||||||||||||
| 0 | 0 |
|
|
|
|
|
|
| IPAIR | NAME | SHIFT | NEWSHIFT | S/N | NAME | SHIFT | NEWSHIFT | S/N |
| 0 | 14240025 | 0.500822 | 0.00000 | 17.6742 | 14240022 | 0.00142645 | 0.499396 | 17.6309 |
| 1 | 14240040 | 0.500291 | 0.000531018 | 18.3084 | 14240039 | -0.000834929 | 0.501657 | 18.2351 |
| 2 | 14240013 | 0.498787 | 0.00203502 | 18.2650 | 14240014 | 0.000553774 | 0.500268 | 18.2128 |
| 3 | 14240036 | 0.500092 | 0.000729978 | 18.0813 | 14240030 | -0.000250888 | 0.501073 | 18.0389 |
| 4 | 14240033 | 0.500604 | 0.000218034 | 17.9697 | 14240035 | 0.000208358 | 0.500614 | 17.9011 |
| 5 | 14240029 | 0.500179 | 0.000643015 | 17.9549 | 14240027 | 0.000597697 | 0.500224 | 17.8857 |
| 6 | 14240037 | 0.500796 | 2.59876e-05 | 17.9010 | 14240019 | 0.000711732 | 0.500110 | 17.8537 |
| 7 | 14240028 | 0.499981 | 0.000841022 | 17.8811 | 14240038 | -0.000142601 | 0.500965 | 17.8302 |
| 8 | 14240020 | 0.499959 | 0.000863016 | 17.8039 | 14240026 | 0.000914993 | 0.499907 | 17.7969 |
| 9 | 14240032 | 0.500489 | 0.000333011 | 17.7348 | 14240034 | 0.000192454 | 0.500630 | 17.7739 |
| 10 | 14240021 | 0.500208 | 0.000613987 | 17.6989 | 14240031 | -0.000435297 | 0.501257 | 17.7329 |
| 11 | 14240016 | 0.499457 | 0.00136501 | 17.6847 | 14240011 | 0.00000 | 0.500822 | 17.6435 |
| 12 | 14240012 | 0.499239 | 0.00158301 | 17.5666 | 14240023 | 0.00202933 | 0.498793 | 17.6036 |
| 13 | 14240017 | 0.499375 | 0.00144702 | 17.5305 | 14240015 | 0.000552146 | 0.500270 | 17.5426 |
| 14 | 14240024 | 0.500602 | 0.000220001 | 17.4715 | 14240018 | 0.000258673 | 0.500563 | 17.5346 |