| Red | Green | Blue | |
| z | 17.64 | ||
| znorm | Inf | ||
| sky | -Inf | -Inf | -NaN |
| S/N | 13.3 | 24.2 | 26.9 |
| S/N(c) | 0.0 | 0.0 | 0.0 |
| SN(E/C) |
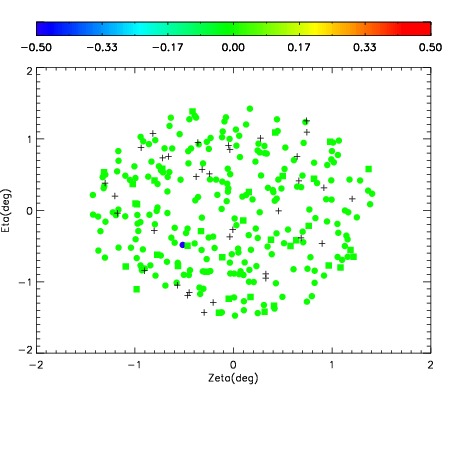
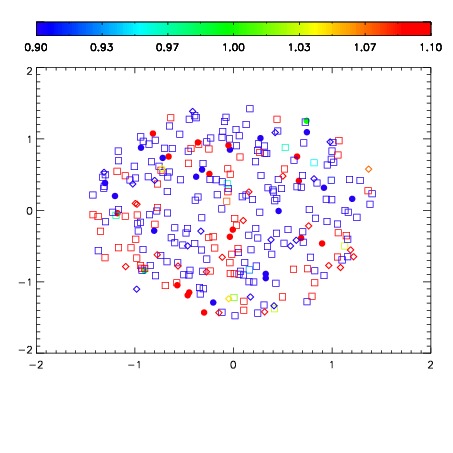
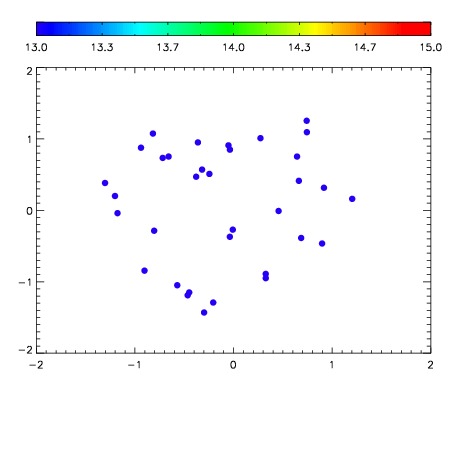

| Frame | Nreads | Zeropoints | Mag plots | Spatial mag deviation | Spatial sky 16325A emission deviations (filled: sky, open: star) | Spatial sky continuum emission | Spatial sky telluric CO2 absorption deviations (filled: H < 10) | |||||||||||||||||||||||
| 0 | 0 |
|
|
|
|
|
|
| IPAIR | NAME | SHIFT | NEWSHIFT | S/N | NAME | SHIFT | NEWSHIFT | S/N |
| 0 | 15530017 | 0.494932 | 0.00000 | 17.5224 | 15530016 | 0.000789680 | 0.494142 | 16.8704 |
| 1 | 15530021 | 0.494836 | 9.59933e-05 | 18.2136 | 15530019 | 0.00132451 | 0.493607 | 18.3888 |
| 2 | 15530018 | 0.494588 | 0.000344008 | 18.1876 | 15530020 | 0.00135122 | 0.493581 | 18.2405 |
| 3 | 15530014 | 0.494536 | 0.000395983 | 15.8359 | 15530012 | 0.00000 | 0.494932 | 16.5720 |