| Red | Green | Blue | |
| z | 17.64 | ||
| znorm | Inf | ||
| sky | -NaN | -Inf | -NaN |
| S/N | 30.0 | 55.2 | 60.6 |
| S/N(c) | 0.0 | 0.0 | 0.0 |
| SN(E/C) |
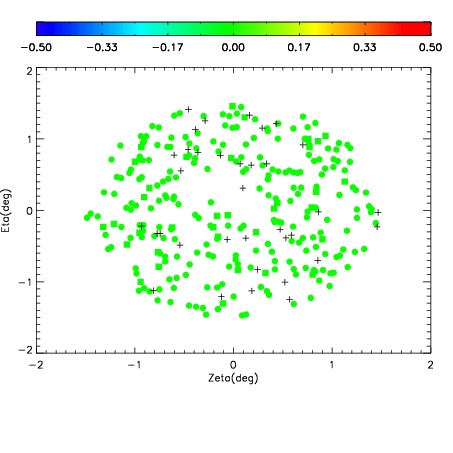

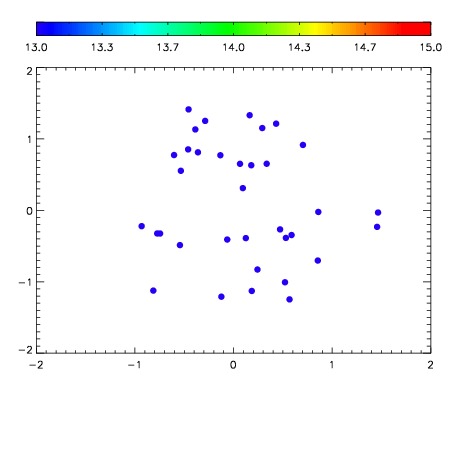

| Frame | Nreads | Zeropoints | Mag plots | Spatial mag deviation | Spatial sky 16325A emission deviations (filled: sky, open: star) | Spatial sky continuum emission | Spatial sky telluric CO2 absorption deviations (filled: H < 10) | |||||||||||||||||||||||
| 0 | 0 |
|
|
|
|
|
|
| IPAIR | NAME | SHIFT | NEWSHIFT | S/N | NAME | SHIFT | NEWSHIFT | S/N |
| 0 | 14490033 | 0.507633 | 0.00000 | 17.5561 | 14490034 | 0.00637753 | 0.501255 | 17.4749 |
| 1 | 14490032 | 0.504176 | 0.00345695 | 18.4812 | 14490018 | 0.000248937 | 0.507384 | 18.5770 |
| 2 | 14490017 | 0.500556 | 0.00707698 | 18.4777 | 14490031 | 0.00422297 | 0.503410 | 18.4640 |
| 3 | 14490012 | 0.498340 | 0.00929296 | 18.4457 | 14490011 | 0.00000 | 0.507633 | 18.3915 |
| 4 | 14490024 | 0.501390 | 0.00624299 | 18.3623 | 14490019 | 0.00100885 | 0.506624 | 18.3152 |
| 5 | 14490020 | 0.501976 | 0.00565696 | 18.2634 | 14490023 | 0.00201842 | 0.505615 | 18.3100 |
| 6 | 14490029 | 0.505444 | 0.00218898 | 18.0501 | 14490030 | 0.00501324 | 0.502620 | 18.2542 |
| 7 | 14490016 | 0.500993 | 0.00663996 | 18.0426 | 14490015 | 0.000289003 | 0.507344 | 18.0789 |
| 8 | 14490025 | 0.502838 | 0.00479496 | 18.0176 | 14490026 | 0.00319463 | 0.504438 | 17.9601 |
| 9 | 14490013 | 0.500497 | 0.00713599 | 17.9166 | 14490014 | 0.000912492 | 0.506720 | 17.9310 |
| 10 | 14490021 | 0.502771 | 0.00486195 | 17.9075 | 14490022 | 0.00274175 | 0.504891 | 17.7308 |
| 11 | 14490028 | 0.503883 | 0.00374997 | 17.4674 | 14490027 | 0.00377608 | 0.503857 | 17.4278 |