| Red | Green | Blue | |
| z | 17.64 | ||
| znorm | Inf | ||
| sky | -NaN | -NaN | -NaN |
| S/N | 24.0 | 42.6 | 46.7 |
| S/N(c) | 0.0 | 0.0 | 0.0 |
| SN(E/C) |


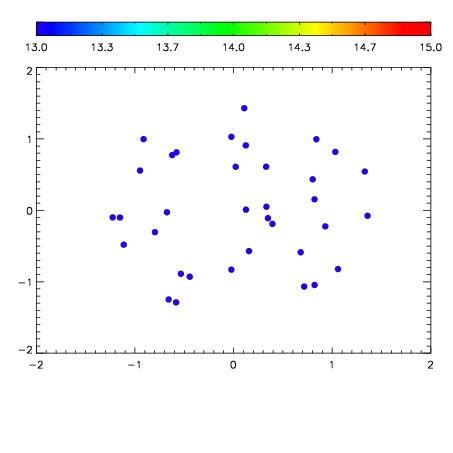

| Frame | Nreads | Zeropoints | Mag plots | Spatial mag deviation | Spatial sky 16325A emission deviations (filled: sky, open: star) | Spatial sky continuum emission | Spatial sky telluric CO2 absorption deviations (filled: H < 10) | |||||||||||||||||||||||
| 0 | 0 |
|
|
|
|
|
|
| IPAIR | NAME | SHIFT | NEWSHIFT | S/N | NAME | SHIFT | NEWSHIFT | S/N |
| 0 | 14590087 | 0.498925 | 0.00000 | 18.4535 | 14590088 | 0.00181948 | 0.497106 | 18.4538 |
| 1 | 14590082 | 0.497423 | 0.00150201 | 18.6591 | 14590081 | 0.00000 | 0.498925 | 18.4916 |
| 2 | 14590083 | 0.498594 | 0.000331014 | 18.4151 | 14590084 | 0.000999579 | 0.497925 | 18.3918 |
| 3 | 14590094 | 0.496803 | 0.00212201 | 18.3780 | 14590093 | 7.66858e-05 | 0.498848 | 18.3642 |
| 4 | 14590090 | 0.498544 | 0.000380993 | 18.2080 | 14590089 | 0.00264458 | 0.496280 | 18.2076 |
| 5 | 14590086 | 0.497551 | 0.00137401 | 17.9553 | 14590085 | 0.000545082 | 0.498380 | 17.8912 |
| 6 | 14590091 | 0.498134 | 0.000791013 | 17.7327 | 14590092 | 0.000847895 | 0.498077 | 17.7291 |