| Red | Green | Blue | |
| z | 17.64 | ||
| znorm | Inf | ||
| sky | -Inf | -Inf | -NaN |
| S/N | 14.7 | 27.3 | 29.8 |
| S/N(c) | 0.0 | 0.0 | 0.0 |
| SN(E/C) |


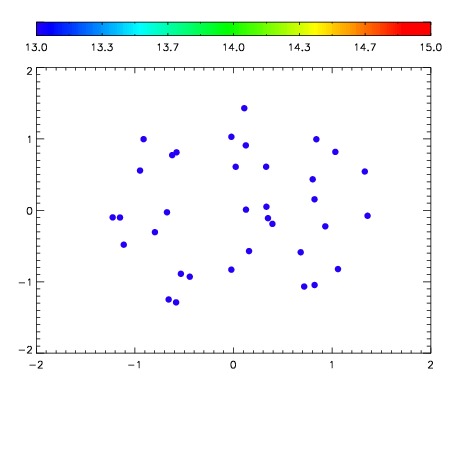

| Frame | Nreads | Zeropoints | Mag plots | Spatial mag deviation | Spatial sky 16325A emission deviations (filled: sky, open: star) | Spatial sky continuum emission | Spatial sky telluric CO2 absorption deviations (filled: H < 10) | |||||||||||||||||||||||
| 0 | 0 |
|
|
|
|
|
|
| IPAIR | NAME | SHIFT | NEWSHIFT | S/N | NAME | SHIFT | NEWSHIFT | S/N |
| 0 | 14600085 | 0.494183 | 0.00000 | 17.9795 | 14600086 | -0.00201941 | 0.496202 | 17.9494 |
| 1 | 14600080 | 0.494141 | 4.19915e-05 | 18.2031 | 14600079 | 0.00000 | 0.494183 | 18.1846 |
| 2 | 14600084 | 0.493995 | 0.000187993 | 18.0279 | 14600083 | -0.00196064 | 0.496144 | 18.1233 |
| 3 | 14600081 | 0.493903 | 0.000279993 | 17.7128 | 14600082 | -0.00139007 | 0.495573 | 17.5052 |