| Red | Green | Blue | |
| z | 17.64 | ||
| znorm | Inf | ||
| sky | -Inf | -Inf | -NaN |
| S/N | 23.8 | 42.6 | 46.3 |
| S/N(c) | 0.0 | 0.0 | 0.0 |
| SN(E/C) |


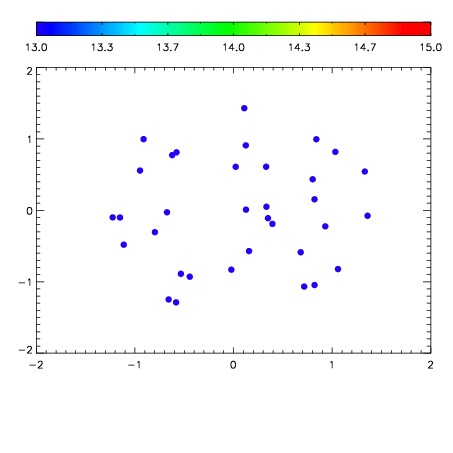

| Frame | Nreads | Zeropoints | Mag plots | Spatial mag deviation | Spatial sky 16325A emission deviations (filled: sky, open: star) | Spatial sky continuum emission | Spatial sky telluric CO2 absorption deviations (filled: H < 10) | |||||||||||||||||||||||
| 0 | 0 |
|
|
|
|
|
|
| IPAIR | NAME | SHIFT | NEWSHIFT | S/N | NAME | SHIFT | NEWSHIFT | S/N |
| 0 | 14770021 | 0.500509 | 0.00000 | 17.5139 | 14770022 | 0.00303448 | 0.497475 | 17.5799 |
| 1 | 14770012 | 0.496182 | 0.00432703 | 18.6544 | 14770011 | 0.00000 | 0.500509 | 18.6408 |
| 2 | 14770017 | 0.498600 | 0.00190902 | 18.6214 | 14770018 | 0.00249202 | 0.498017 | 18.6087 |
| 3 | 14770020 | 0.499589 | 0.000920027 | 18.4432 | 14770019 | 0.00285748 | 0.497652 | 18.4664 |
| 4 | 14770013 | 0.497161 | 0.00334802 | 18.4359 | 14770014 | 0.00160648 | 0.498903 | 18.4041 |
| 5 | 14770016 | 0.499144 | 0.00136504 | 17.9143 | 14770015 | 0.00183092 | 0.498678 | 17.9634 |