| Red | Green | Blue | |
| z | 17.64 | ||
| znorm | Inf | ||
| sky | -NaN | -Inf | -NaN |
| S/N | 18.3 | 30.9 | 36.2 |
| S/N(c) | 0.0 | 0.0 | 0.0 |
| SN(E/C) |
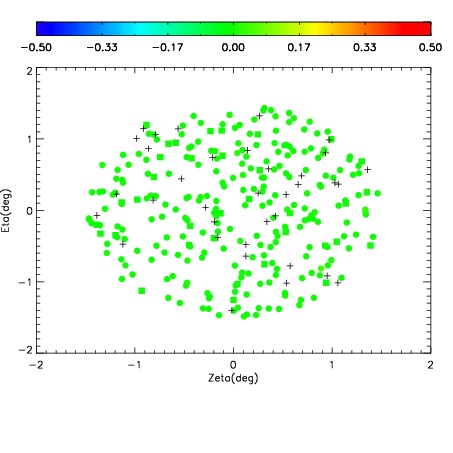


| Frame | Nreads | Zeropoints | Mag plots | Spatial mag deviation | Spatial sky 16325A emission deviations (filled: sky, open: star) | Spatial sky continuum emission | Spatial sky telluric CO2 absorption deviations (filled: H < 10) | |||||||||||||||||||||||
| 0 | 0 |
|
|
|
|
|
|
| IPAIR | NAME | SHIFT | NEWSHIFT | S/N | NAME | SHIFT | NEWSHIFT | S/N |
| 0 | 17740043 | 0.000999858 | 0.00000 | 18.2885 | 17740044 | -0.510236 | 0.511236 | 18.2801 |
| 1 | 17740039 | 0.00000 | 0.000999858 | 18.5639 | 17740040 | -0.510241 | 0.511241 | 18.5139 |
| 2 | 17740042 | 0.000645150 | 0.000354708 | 18.3373 | 17740041 | -0.510823 | 0.511823 | 18.4827 |