| Red | Green | Blue | |
| z | 17.64 | ||
| znorm | Inf | ||
| sky | -NaN | -Inf | -NaN |
| S/N | 25.0 | 42.5 | 48.7 |
| S/N(c) | 0.0 | 0.0 | 0.0 |
| SN(E/C) |


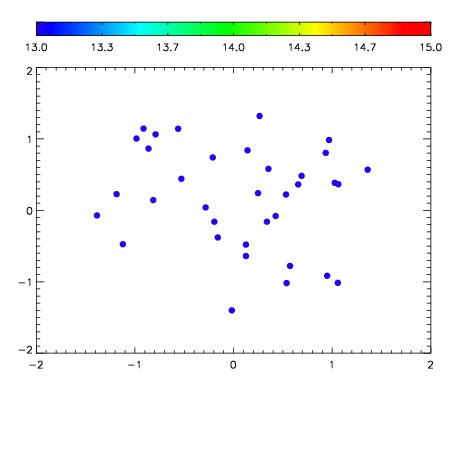

| Frame | Nreads | Zeropoints | Mag plots | Spatial mag deviation | Spatial sky 16325A emission deviations (filled: sky, open: star) | Spatial sky continuum emission | Spatial sky telluric CO2 absorption deviations (filled: H < 10) | |||||||||||||||||||||||
| 0 | 0 |
|
|
|
|
|
|
| IPAIR | NAME | SHIFT | NEWSHIFT | S/N | NAME | SHIFT | NEWSHIFT | S/N |
| 0 | 17760033 | 0.513078 | 0.00000 | 18.6280 | 17760034 | 0.00364891 | 0.509429 | 18.6516 |
| 1 | 17760028 | 0.509030 | 0.00404799 | 18.7007 | 17760027 | 0.000630880 | 0.512447 | 18.6554 |
| 2 | 17760032 | 0.512563 | 0.000514984 | 18.3424 | 17760031 | 0.00377909 | 0.509299 | 18.3218 |
| 3 | 17760029 | 0.510509 | 0.00256896 | 18.1542 | 17760030 | 0.00393637 | 0.509142 | 18.2224 |
| 4 | 17760025 | 0.511600 | 0.00147796 | 18.1228 | 17760026 | 0.00136641 | 0.511712 | 18.0654 |
| 5 | 17760024 | 0.510198 | 0.00287998 | 17.8573 | 17760023 | 0.00000 | 0.513078 | 17.9519 |