| Red | Green | Blue | |
| z | 17.64 | ||
| znorm | Inf | ||
| sky | -Inf | -Inf | -NaN |
| S/N | 13.4 | 24.7 | 27.5 |
| S/N(c) | 0.0 | 0.0 | 0.0 |
| SN(E/C) |
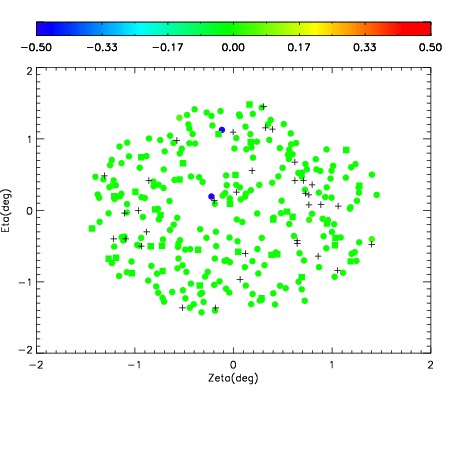
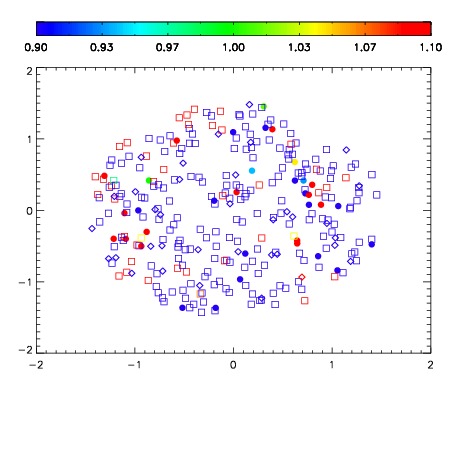


| Frame | Nreads | Zeropoints | Mag plots | Spatial mag deviation | Spatial sky 16325A emission deviations (filled: sky, open: star) | Spatial sky continuum emission | Spatial sky telluric CO2 absorption deviations (filled: H < 10) | |||||||||||||||||||||||
| 0 | 0 |
|
|
|
|
|
|
| IPAIR | NAME | SHIFT | NEWSHIFT | S/N | NAME | SHIFT | NEWSHIFT | S/N |
| 0 | 17710027 | 0.513270 | 0.00000 | 17.5969 | 17710026 | 0.00000 | 0.513270 | 17.4833 |
| 1 | 17710031 | 0.506816 | 0.00645399 | 18.4058 | 17710030 | -0.000420439 | 0.513690 | 18.3950 |
| 2 | 17710028 | 0.513265 | 5.00679e-06 | 17.6363 | 17710029 | -0.000290479 | 0.513560 | 17.6860 |