| Red | Green | Blue | |
| z | 17.64 | ||
| znorm | Inf | ||
| sky | -Inf | -Inf | -NaN |
| S/N | 19.4 | 33.6 | 38.2 |
| S/N(c) | 0.0 | 0.0 | 0.0 |
| SN(E/C) |
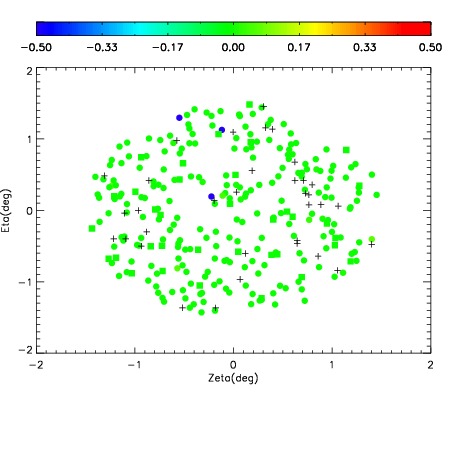
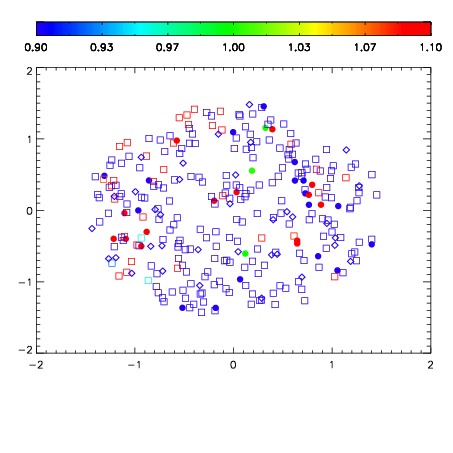
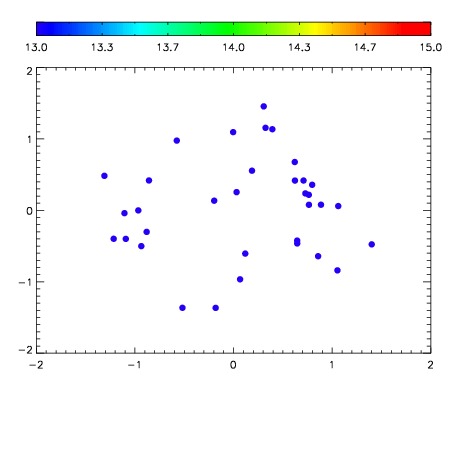

| Frame | Nreads | Zeropoints | Mag plots | Spatial mag deviation | Spatial sky 16325A emission deviations (filled: sky, open: star) | Spatial sky continuum emission | Spatial sky telluric CO2 absorption deviations (filled: H < 10) | |||||||||||||||||||||||
| 0 | 0 |
|
|
|
|
|
|
| IPAIR | NAME | SHIFT | NEWSHIFT | S/N | NAME | SHIFT | NEWSHIFT | S/N |
| 0 | 17730024 | 0.00220644 | 0.00000 | 18.1245 | 17730023 | -0.508349 | 0.510555 | 18.0062 |
| 1 | 17730021 | 0.00176192 | 0.000444520 | 18.8319 | 17730022 | -0.508948 | 0.511154 | 18.8238 |
| 2 | 17730017 | 0.00000 | 0.00220644 | 17.8670 | 17730019 | -0.509187 | 0.511393 | 17.8294 |
| 3 | 17730020 | 0.00160667 | 0.000599770 | 17.8411 | 17730018 | -0.509322 | 0.511528 | 17.8118 |